Table of Contents
Introduction
This is a technical study on COVID-19 infected cases on a few selected states in Malaysia which are, Sabah, Sarawak, Johore, Negeri Sembilan and Melaka. The objective of this study is to simulate the susceptible cases, exposed cases, infected cases, hospitalized cases as well as recovered cases within the next couple of months in Malaysia by following the current trend of the covid-19 infected cases.
Methodology
Since susceptible are the possible number of population that has the possibility of infection, different number of ratio are used and tested. Findings show that 0.1% of the state population works best and reflects the current state of the pandemic.
These are the constant parameters that will be used for this model:
- prog.dist.shape which is the intensity of the infection is set up to 0.5
- prog.dist.scale which is the duration of the infection is set up to 15 days
- rec.dist.shape which is the recovery intensity is kept constant to 1.5
- rec.dist.scale which is the duration recovery is kept constant for up to 35 days.
- hosp.rate which is the hospital rate is at 1% following the current rate of hospital.
Fatality parameters are also kept constant:
- fat.rate.base = 2/500
- fat.rate.overcap = 1/1000
- fat.tcoeff = 0.2
The parameters are set as assumptions according to the current trend of COVID-19 cases in Malaysia
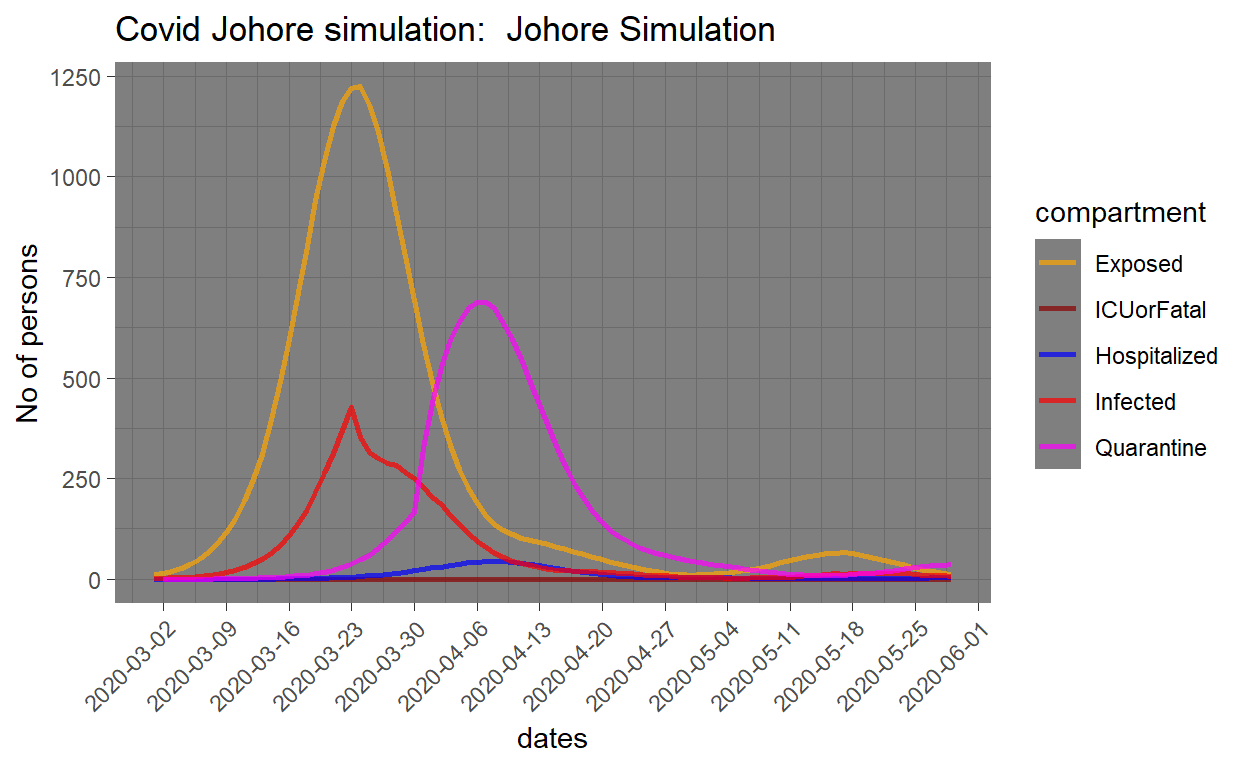
Johore
In Johore the total number of confirmed COVID-19 cases is 395 cases (as of 2nd April 2020). The total population of the high density district will be taken into the simulation which are about 3.8 million population. The hospital capacity is determined by the number of beds from the admitting hospitals with a capacity of 1,023 beds.
The parameters to be used are as below:
The number of people infected which is the i.num is set up to 1 people infected due to low initial cases of covid cases in this state while the s.num is set at 3,841,538 total population.
The number of infection, expose is set as below:
- inf.prob.i up to 0.065. This is the infection rate for the infected
- act.rate.i up to 10. This is number of which the infection may get infected to people
- inf.prob.e up to 0.03. This is the infection rate to expose
- act.rate.e up to 10. This is number of which the infection may get expose to people
These parameters are set as assumptions according to the infection and expose rate in the states.
  i.num =  1, s.num = 3841538 - 1,
  e.num = 0, q.num = 0,   h.num = 0,  r.num = 0, f.num = 0,
  prog.rand =  FALSE,
  prog.dist.shape = 1.5,
  prog.dist.scale =  15,
  prog.rate = 10/100,
  rec.rand = FALSE,
  rec.dist.shape =  1.5,
  rec.dist.scale = 35,
  rec.rate = 2/100,
  fat.rand =  FALSE,
  fat.rate.base = 1.5/500,
  fat.rate.overcap = 1/1000,
  fat.tcoeff = 0.2,
  quar.rand = FALSE,
  quar.rate = c(rep(1/10,30), rep(1/3, 335)),
  hosp.rand =  FALSE,
  hosp.rate = 1/100,
  disch.rand = FALSE,
  disch.rate =  2/100,
  inf.prob.i = 0.065, act.rate.i =  10,
  inf.prob.e = 0.03, act.rate.e =  10,
  inf.prob.q = 0.02, act.rate.q =   2,
  hosp.cap = 1206,
  vital = FALSE,
  a.rate = 1/1000, a.prop.e = 1/1000, a.prop.i = 1/1000,
  a.prop.q = 1/1000, ds.rate = 1/1000, de.rate = 1/1000,
  di.rate = 1/1000, dq.rate = 1/1000,  dh.rate = 1/1000,
  dr.rate = 1/1000,
  s_mix_ratio = 1/1000
  s.num = round(s.num*s_mix_ratio,0) - i.num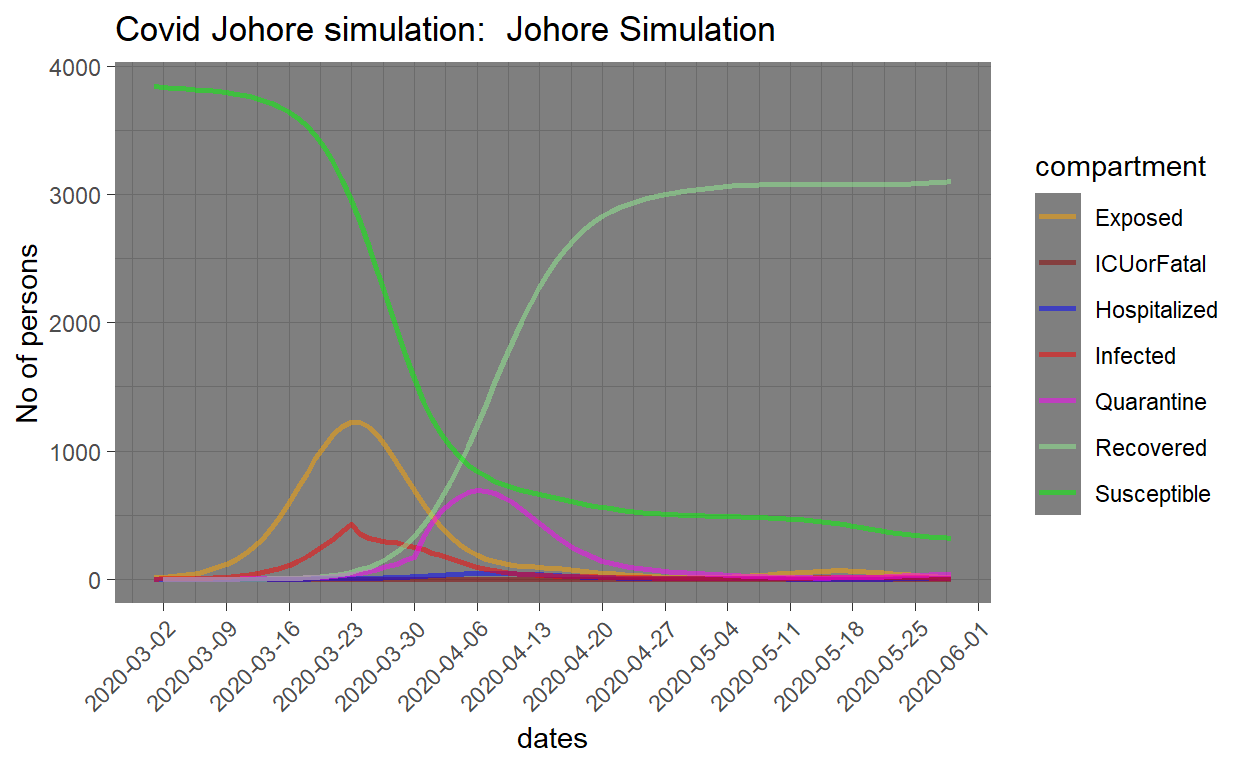
Findings
By using the parameters, the trend of the infected cases from the simulation is almost the same the current trend of the covid cases in Johore, where by on 2nd April 2020 the infected cases from the current trend is up to 395 cases where by in the simulation trend the infected cases are at a similar rate which are about 408 number of people infected.
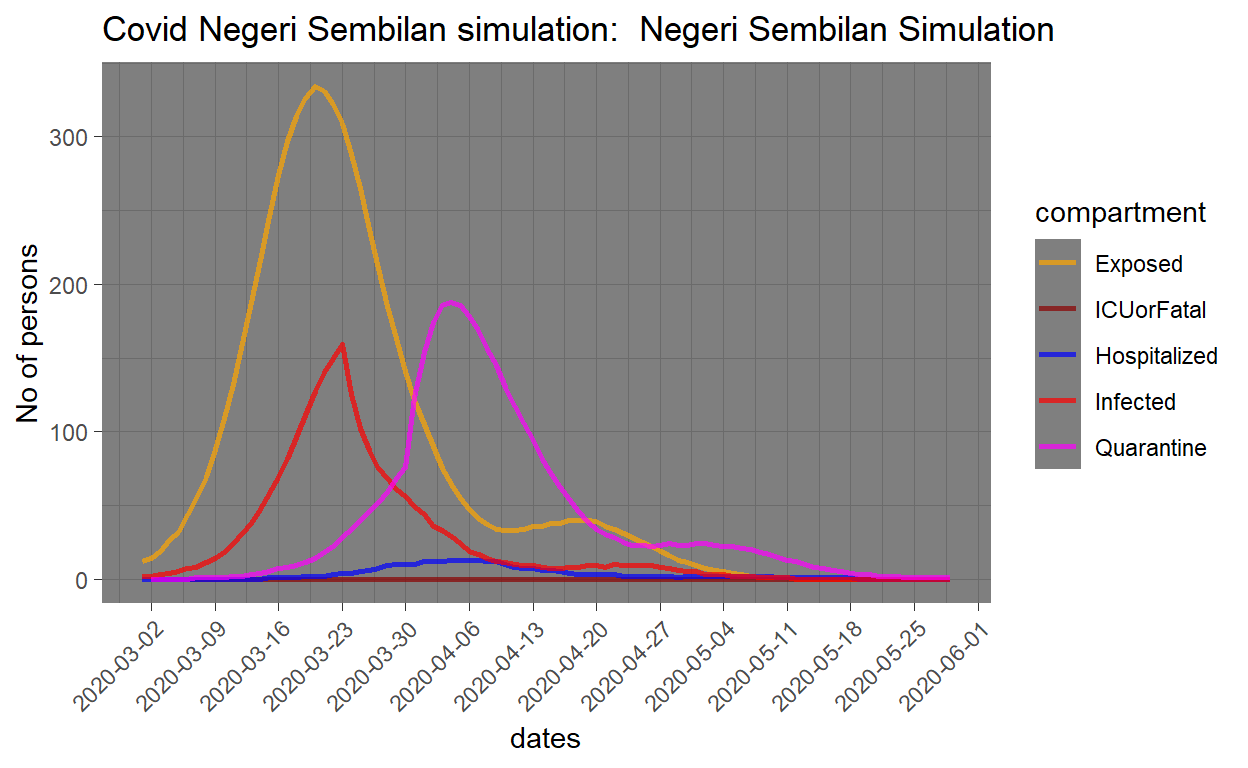
Negeri Sembilan
In Negeri Sembilan the total number of confirmed COVID-19 cases is 207 cases (as of 2nd April 2020). The total population of the high density district will be taken into the simulation which are about 1.1 million population. The hospital capacity is determined by the number of beds from the admitting hospitals with a capacity of 1,070 beds.
The parameters to be used are as below:
The number of people infected which is the i.num is set up to 1 people infected due to low initial cases of covid cases in this state while the s.num is set at 1,121,048 total population.
The number of infection, expose is set as below:
- inf.prob.i up to 0.065. This is the infection rate for the infected
- act.rate.i up to 10. This is number of which the infection may get infected to people
- inf.prob.e up to 0.03. This is the infection rate to expose
- act.rate.e up to 10. This is number of which the infection may get expose to people
These parameters are set as assumptions according to the infection and expose rate in the states.
  i.num =  1, s.num = 1121048 - 1,
  e.num = 0, q.num = 0,   h.num = 0,  r.num = 0, f.num = 0,
  prog.rand =  FALSE,
  prog.dist.shape = 1.5,
  prog.dist.scale =  15,
  prog.rate = 10/100,
  rec.rand = FALSE,
  rec.dist.shape =  1.5,
  rec.dist.scale = 35,
  rec.rate = 2/100,
  fat.rand =  FALSE,
  fat.rate.base = 1.5/500,
  fat.rate.overcap = 1/1000,
  fat.tcoeff = 0.2,
  quar.rand = FALSE,
  quar.rate = c(rep(1/10,30), rep(1/3, 335)),
  hosp.rand =  FALSE,
  hosp.rate = 1/100,
  disch.rand = FALSE,
  disch.rate =  2/100,
  inf.prob.i = 0.065, act.rate.i =  10,
  inf.prob.e = 0.03, act.rate.e =  10,
  inf.prob.q = 0.02, act.rate.q =   2,
  hosp.cap = 1070,
  vital = FALSE,
  a.rate = 1/1000, a.prop.e = 1/1000, a.prop.i = 1/1000,
  a.prop.q = 1/1000, ds.rate = 1/1000, de.rate = 1/1000,
  di.rate = 1/1000, dq.rate = 1/1000,  dh.rate = 1/1000,
  dr.rate = 1/1000,
  s_mix_ratio = 1/1000
  s.num = round(s.num*s_mix_ratio,0) - i.num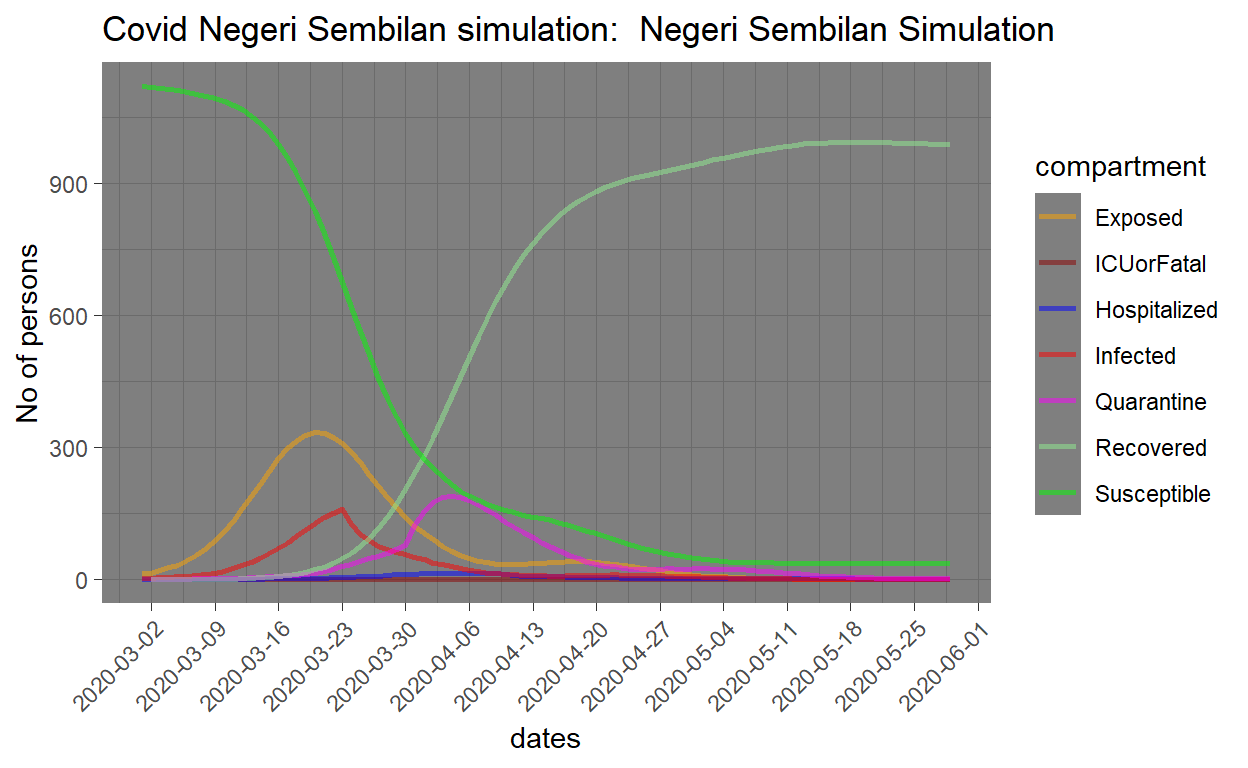
Findings
By using the parameters, the trend of the infected cases from the simulation is almost the same the current trend of the covid cases in Negeri Sembilan, where by on 2nd April 2020 the infected cases from the current trend is up to 207 cases where by in the simulation trend the infected cases are at a similar rate which are about 202 number of people infected.
Melaka
In Melaka the total number of confirmed COVID-19 cases is 70 cases (as of 2nd April 2020). The total population of the high density district will be taken into the simulation which are about 950,000 population. The hospital capacity is determined by the number of beds from the admitting hospitals with a capacity of 806 beds.
The parameters to be used are as below:
The number of people infected which is the i.num is set up to 1 people infected due to low initial cases of covid cases in this state while the s.num is set at 959,627 total population.
The number of infection, expose is set as below:
- inf.prob.i up to 0.03. This is the infection rate for the infected
- act.rate.i up to 10. This is number of which the infection may get infected to people
- inf.prob.e up to 0.03. This is the infection rate to expose
- act.rate.e up to 10. This is number of which the infection may get expose to people
These parameters are set as assumptions according to the infection and expose rate in the states.
  i.num =  1, s.num = 959627 - 1,
  e.num = 0, q.num = 0,   h.num = 0,  r.num = 0, f.num = 0,
  prog.rand =  FALSE,
  prog.dist.shape = 1.5,
  prog.dist.scale =  15,
  prog.rate = 10/100,
  rec.rand = FALSE,
  rec.dist.shape =  1.5,
  rec.dist.scale = 35,
  rec.rate = 2/100,
  fat.rand =  FALSE,
  fat.rate.base = 1.5/500,
  fat.rate.overcap = 1/1000,
  fat.tcoeff = 0.2,
  quar.rand = FALSE,
  quar.rate = c(rep(1/10,30), rep(1/3, 335)),
  hosp.rand =  FALSE,
  hosp.rate = 1/100,
  disch.rand = FALSE,
  disch.rate =  2/100,
  inf.prob.i = 0.03, act.rate.i =  10,
  inf.prob.e = 0.03, act.rate.e =  10,
  inf.prob.q = 0.02, act.rate.q =   2,
  hosp.cap = 806,
  vital = FALSE,
  a.rate = 1/1000, a.prop.e = 1/1000, a.prop.i = 1/1000,
  a.prop.q = 1/1000, ds.rate = 1/1000, de.rate = 1/1000,
  di.rate = 1/1000, dq.rate = 1/1000,  dh.rate = 1/1000,
  dr.rate = 1/1000,
  s_mix_ratio = 1/1000
  s.num = round(s.num*s_mix_ratio,0) - i.num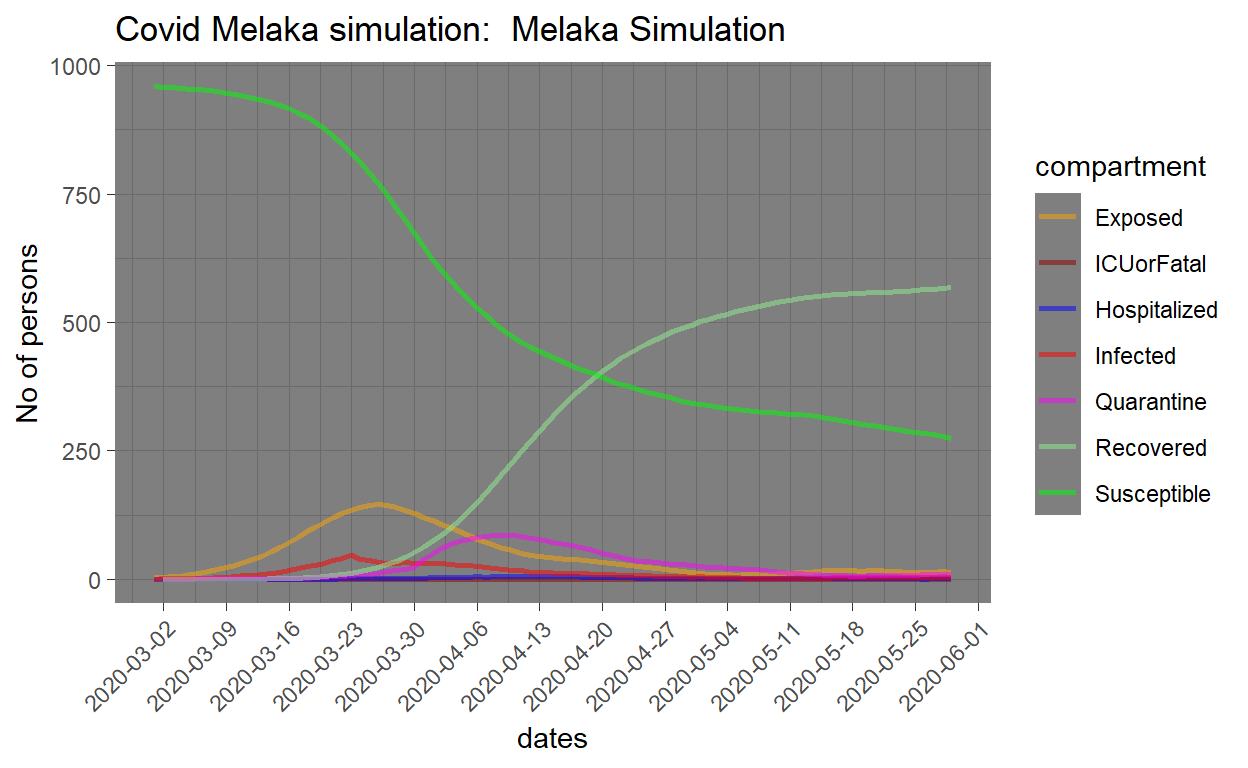
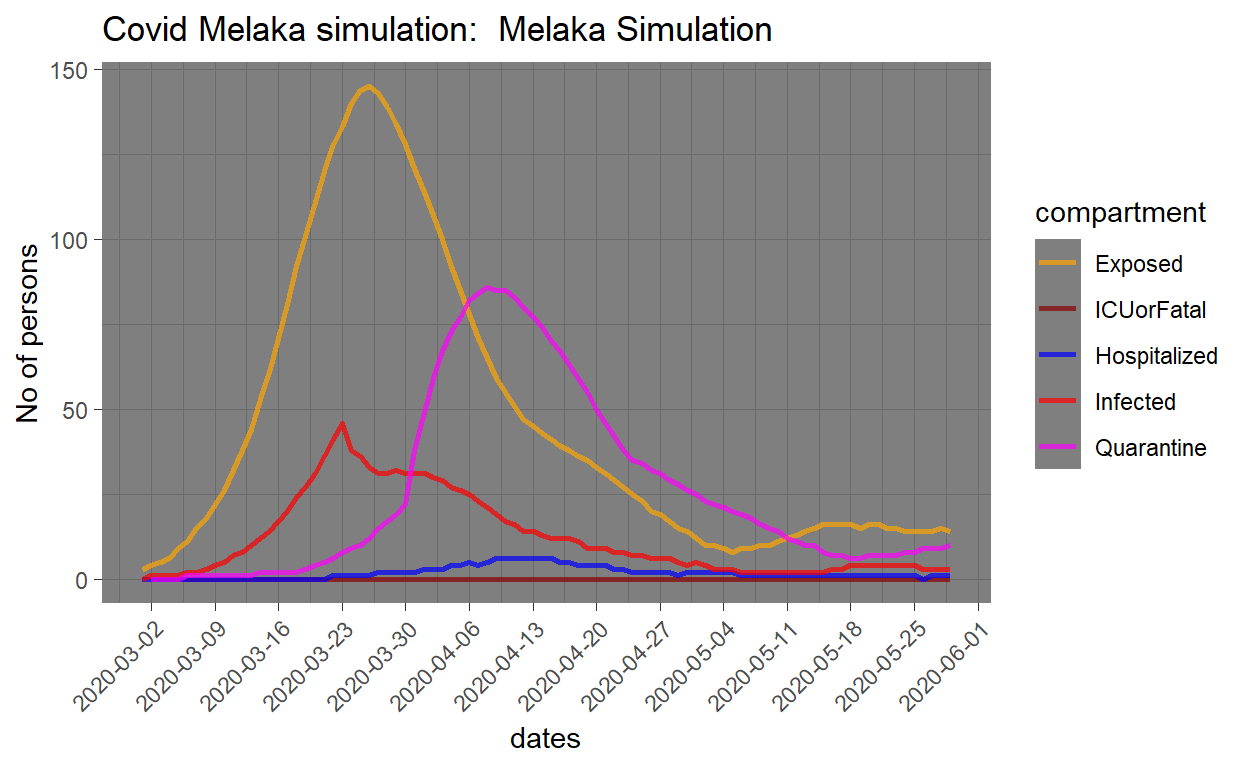
Findings
By using the parameters, the trend of the infected cases from the simulation is almost the same the current trend of the covid cases in Melaka, where by on 2nd April 2020 the infected cases from the current trend is up to 70 cases where by in the simulation trend the infected cases are at a similar rate which are about 80 number of people infected.
Labuan
In Labuan the total number of confirmed COVID-19 cases is 10 cases (as of 2nd April 2020). The total population of the high density district will be taken into the simulation which are about 90,000 population. The hospital capacity is determined by the number of beds from the admitting hospitals with a capacity of 278 beds.
The parameters to be used are as below:
The number of people infected which is the i.num is set up to 1 people infected due to low initial cases of covid cases in this state while the s.num is set at 91,761 total population.
The number of infection, expose is set as below:
- inf.prob.i up to 0.03. This is the infection rate for the infected
- act.rate.i up to 10. This is number of which the infection may get infected to people
- inf.prob.e up to 0.03. This is the infection rate to expose
- act.rate.e up to 10. This is number of which the infection may get expose to people
These parameters are set as assumptions according to the infection and expose rate in the states.
  i.num =  1, s.num = 91761 - 1,
  e.num = 0, q.num = 0,   h.num = 0,  r.num = 0, f.num = 0,
  prog.rand =  FALSE,
  prog.dist.shape = 1.5,
  prog.dist.scale =  15,
  prog.rate = 10/100,
  rec.rand = FALSE,
  rec.dist.shape =  1.5,
  rec.dist.scale = 35,
  rec.rate = 2/100,
  fat.rand =  FALSE,
  fat.rate.base = 1.5/500,
  fat.rate.overcap = 1/1000,
  fat.tcoeff = 0.2,
  quar.rand = FALSE,
  quar.rate = c(rep(1/10,30), rep(1/3, 335)),
  hosp.rand =  FALSE,
  hosp.rate = 1/100,
  disch.rand = FALSE,
  disch.rate =  2/100,
  inf.prob.i = 0.03, act.rate.i =  10,
  inf.prob.e = 0.03, act.rate.e =  10,
  inf.prob.q = 0.02, act.rate.q =   2,
  hosp.cap = 278,
  vital = FALSE,
  a.rate = 1/1000, a.prop.e = 1/1000, a.prop.i = 1/1000,
  a.prop.q = 1/1000, ds.rate = 1/1000, de.rate = 1/1000,
  di.rate = 1/1000, dq.rate = 1/1000,  dh.rate = 1/1000,
  dr.rate = 1/1000,
  s_mix_ratio = 1/1000
  s.num = round(s.num*s_mix_ratio,0) - i.num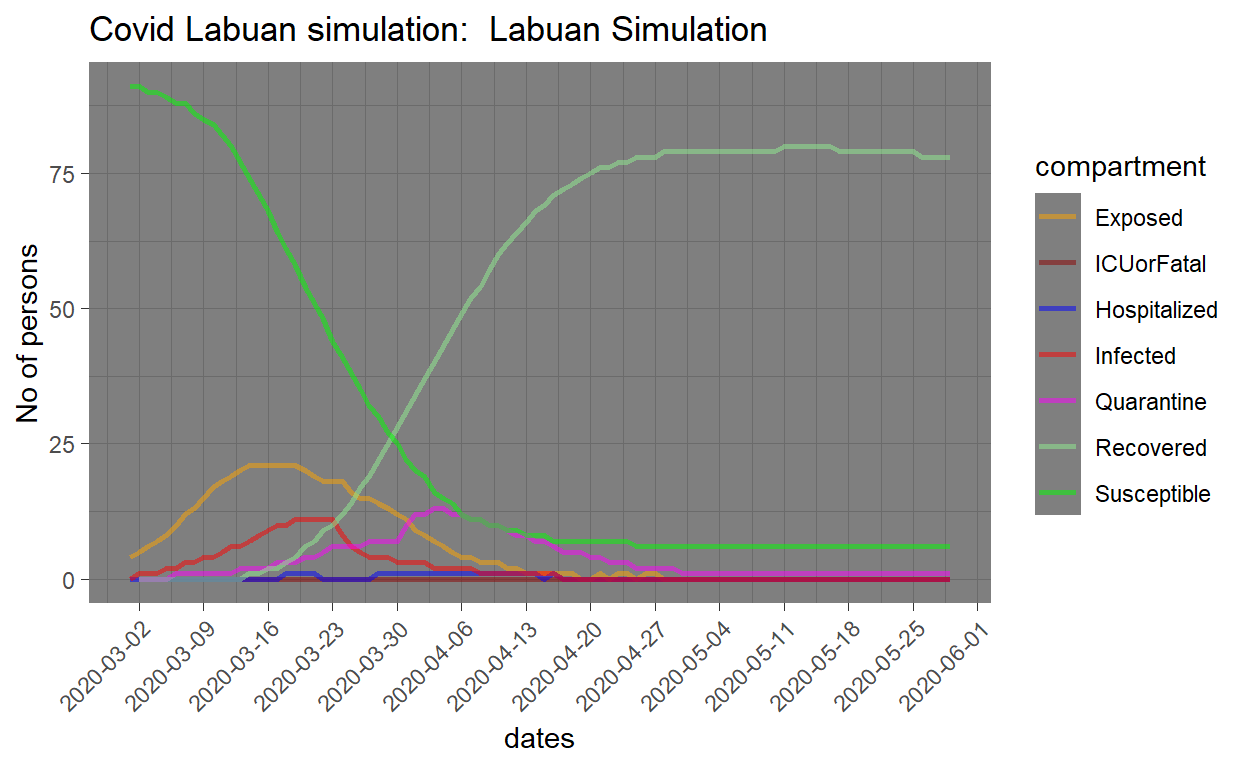
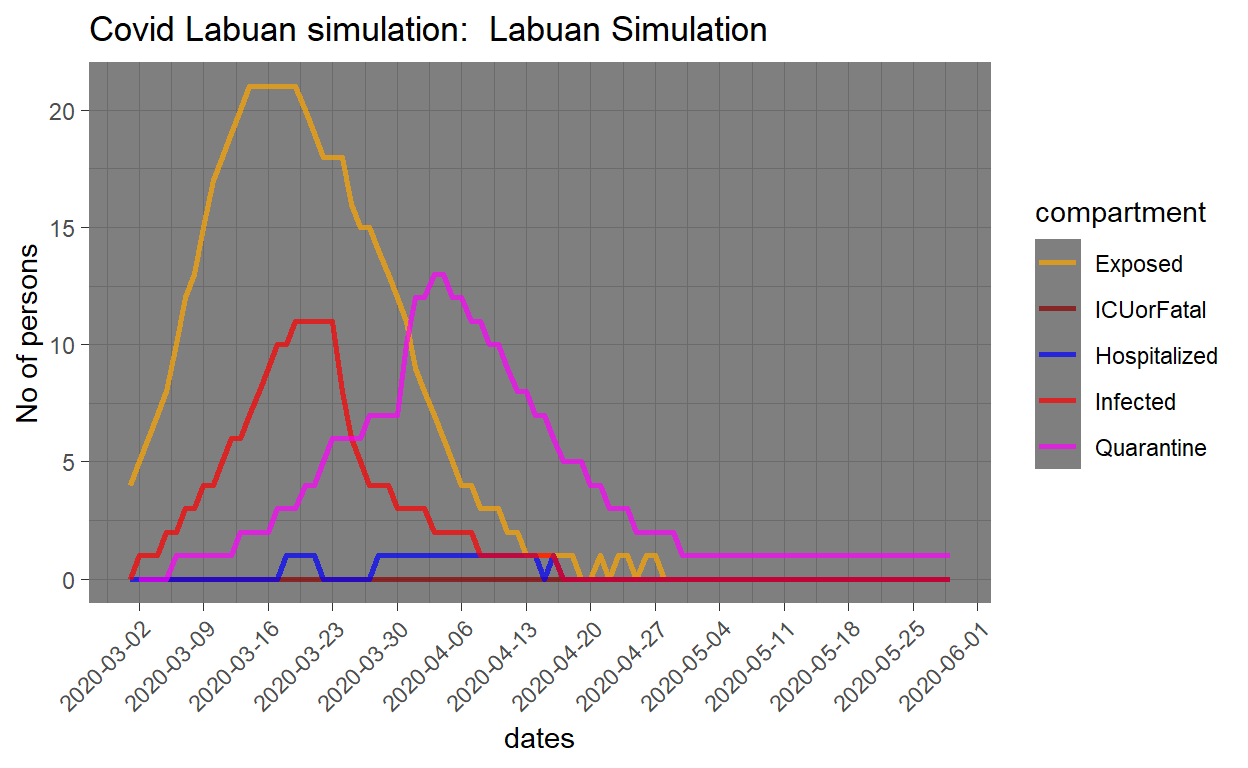
Findings
By using the parameters, the trend of the infected cases from the simulation is almost the same the current trend of the covid cases in Labuan, where by on 2nd April 2020 the infected cases from the current trend is up to 13 cases where by in the simulation trend the infected cases are at a similar rate which are about 10 number of people infected.
Sabah
In Sabah the total number of confirmed COVID-19 cases is 210 cases (as of 2nd April 2020). The total population of the high density district will be taken into the simulation which are about 4 million population. The hospital capacity is determined by the number of beds from the admitting hospitals with a capacity of 2,203 beds.
The parameters to be used are as below:
The number of people infected which is the i.num is set up to 1 people infected due to low initial cases of covid cases in this state while the s.num is set at 4,064,604 total population.
The number of infection, expose is set as below:
- inf.prob.i up to 0.035. This is the infection rate for the infected
- act.rate.i up to 10. This is number of which the infection may get infected to people
- inf.prob.e up to 0.03. This is the infection rate to expose
- act.rate.e up to 10. This is number of which the infection may get expose to people
These parameters are set as assumptions according to the infection and expose rate in the states.
  i.num =  1, s.num = 4064604 - 1,
  e.num = 0, q.num = 0,   h.num = 0,  r.num = 0, f.num = 0,
  prog.rand =  FALSE,
  prog.dist.shape = 1.5,
  prog.dist.scale =  15,
  prog.rate = 10/100,
  rec.rand = FALSE,
  rec.dist.shape =  1.5,
  rec.dist.scale = 35,
  rec.rate = 2/100,
  fat.rand =  FALSE,
  fat.rate.base = 1.5/500,
  fat.rate.overcap = 1/1000,
  fat.tcoeff = 0.2,
  quar.rand = FALSE,
  quar.rate = c(rep(1/10,30), rep(1/3, 335)),
  hosp.rand =  FALSE,
  hosp.rate = 1/100,
  disch.rand = FALSE,
  disch.rate =  2/100,
  inf.prob.i = 0.035, act.rate.i =  10,
  inf.prob.e = 0.03, act.rate.e =  10,
  inf.prob.q = 0.02, act.rate.q =   2,
  hosp.cap = 2203,
  vital = FALSE,
  a.rate = 1/1000, a.prop.e = 1/1000, a.prop.i = 1/1000,
  a.prop.q = 1/1000, ds.rate = 1/1000, de.rate = 1/1000,
  di.rate = 1/1000, dq.rate = 1/1000,  dh.rate = 1/1000,
  dr.rate = 1/1000,
  s_mix_ratio = 1/1000
  s.num = round(s.num*s_mix_ratio,0) - i.num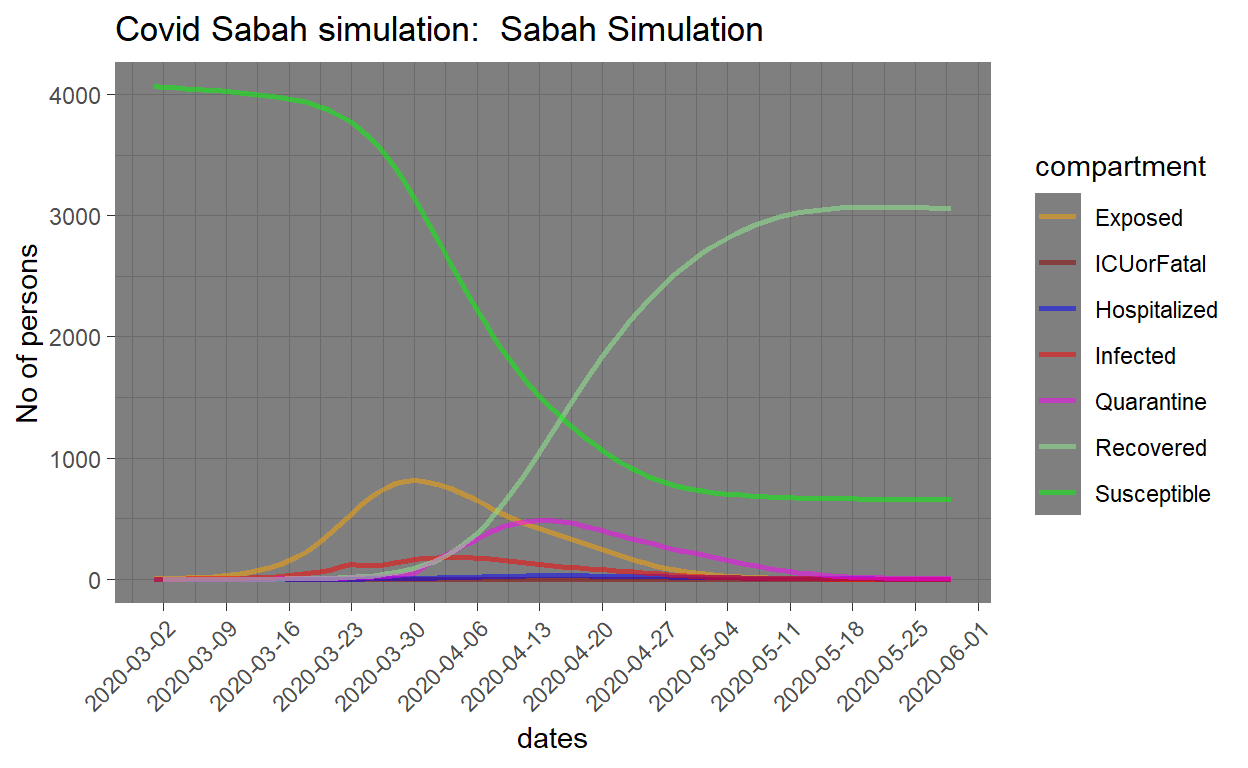
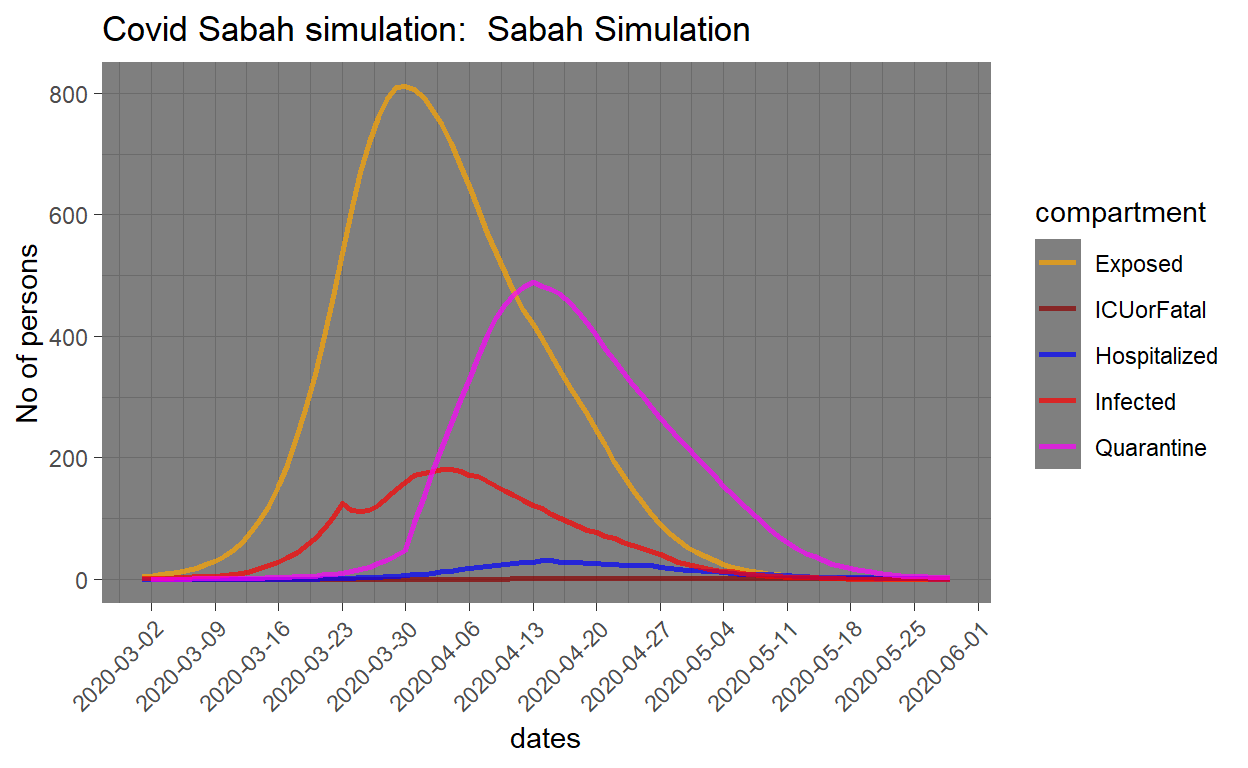
Findings
By using the parameters, the trend of the infected cases from the simulation is almost the same the current trend of the covid cases in Sabah, where by on 2nd April 2020 the infected cases from the current trend is up to 270 cases where by in the simulation trend the infected cases are at a similar rate which are about 210 number of people infected.
Sarawak
In Sarawak the total number of confirmed COVID-19 cases is 211 cases (as of 2nd April 2020). The total population of the high density district will be taken into the simulation which are about 2.6 million population. The hospital capacity is determined by the number of beds from the admitting hospitals with a capacity of 2,155 beds.
The parameters to be used are as below:
The number of people infected which is the i.num is set up to 1 people infected due to low initial cases of covid cases in this state while the s.num is set at 2,697,162 total population.
The number of infection, expose is set as below:
- inf.prob.i up to 0.04. This is the infection rate for the infected
- act.rate.i up to 10. This is number of which the infection may get infected to people
- inf.prob.e up to 0.03. This is the infection rate to expose
- act.rate.e up to 10. This is number of which the infection may get expose to people
These parameters are set as assumptions according to the infection and expose rate in the states.
  i.num =  1, s.num = 2697162 - 1,
  e.num = 0, q.num = 0,   h.num = 0,  r.num = 0, f.num = 0,
  prog.rand =  FALSE,
  prog.dist.shape = 1.5,
  prog.dist.scale =  15,
  prog.rate = 10/100,
  rec.rand = FALSE,
  rec.dist.shape =  1.5,
  rec.dist.scale = 35,
  rec.rate = 2/100,
  fat.rand =  FALSE,
  fat.rate.base = 1.5/500,
  fat.rate.overcap = 1/1000,
  fat.tcoeff = 0.2,
  quar.rand = FALSE,
  quar.rate = c(rep(1/10,30), rep(1/3, 335)),
  hosp.rand =  FALSE,
  hosp.rate = 1/100,
  disch.rand = FALSE,
  disch.rate =  2/100,
  inf.prob.i = 0.04, act.rate.i =  10,
  inf.prob.e = 0.03, act.rate.e =  10,
  inf.prob.q = 0.02, act.rate.q =   2,
  hosp.cap = 2155,
  vital = FALSE,
  a.rate = 1/1000, a.prop.e = 1/1000, a.prop.i = 1/1000,
  a.prop.q = 1/1000, ds.rate = 1/1000, de.rate = 1/1000,
  di.rate = 1/1000, dq.rate = 1/1000,  dh.rate = 1/1000,
  dr.rate = 1/1000,
  s_mix_ratio = 1/1000
  s.num = round(s.num*s_mix_ratio,0) - i.num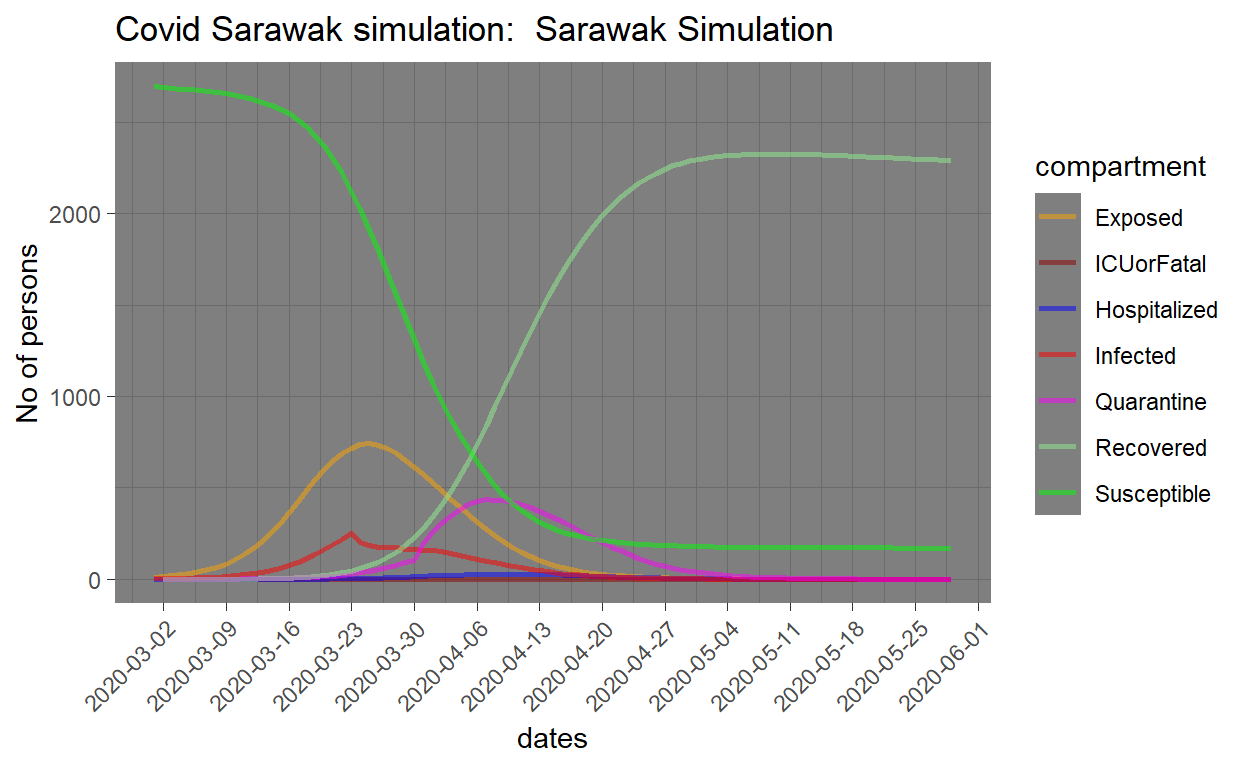
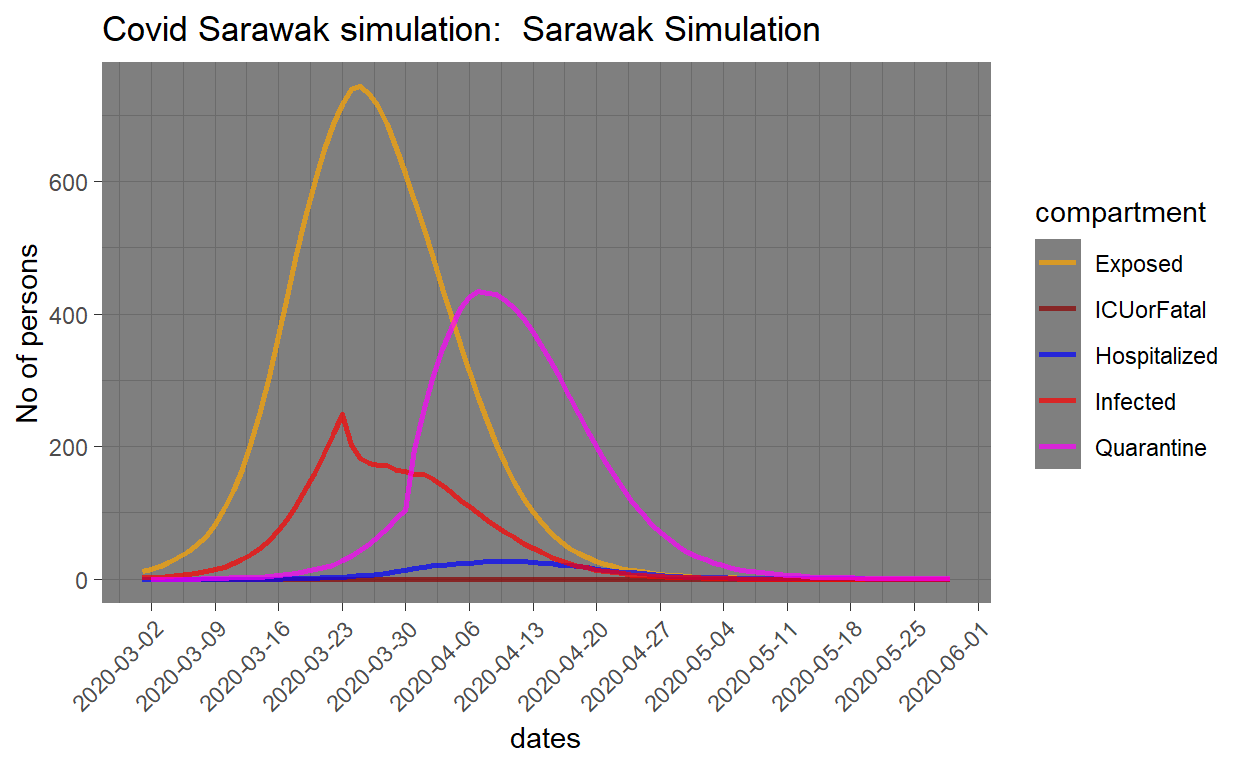
Findings
By using the parameters, the trend of the infected cases from the simulation is almost the same the current trend of the covid cases in Sarawak, where by on 2nd April 2020 the infected cases from the current trend is up to 206 cases where by in the simulation trend the infected cases are at a similar rate which are about 211 number of people infected.
References
- Worldpop. “WorldPop.” Worldpop, https://www.worldpop.org/.
- “GADM Maps and Data.” GADM, https://gadm.org/.
- Hospital Screening Centre in Malaysia. http://www.moh.gov.my/moh/resources/Penerbitan/Garis%20Panduan/COVID19/Annex_3_Screening_centre_24032020.pdf
- Public Hospitals in Melaka, http://hospital.com.my/directory/Melaka/public/index.htm.
- Public Hospitals in Negeri Sembilan, http://hospital.com.my/directory/Negeri_Sembilan/public/index.htm.
- Public Hospitals in Johore, http://hospital.com.my/directory/Johore/public/index.htm.
- Public Hospitals in Labuan, http://hospital.com.my/directory/Labuan/public/index.htm.
- Public Hospitals in Sawawak, http://hospital.com.my/directory/Sawawak/public/index.htm.
- Public Hospitals in Sabah, http://hospital.com.my/directory/Sabah/public/index.htm.
- Account, KKMPutrajayaVerified. “KKMPutrajaya (@KKMPutrajaya).” Twitter, Twitter, 25 Mar. 2020, https://twitter.com/KKMPutrajaya.
- Facebook Data For Good, https://dataforgood.fb.com/tools/population-density-maps/
- Evozi. “COVID-19: Malaysia Outbreak Monitor: Live Updates.” COVID-19 | Malaysia Outbreak Monitor | Live Updates, https://www.outbreak.my/.