Table of Contents
Introduction
This is a technical study on COVID-19 infected cases on the northern region of Malaysia. The 4 states included are Perak, Kedah, Penang and Perlis. The objective of this study is to simulate the susceptible cases, exposed cases, infected cases, hospitalized cases as well as recovered cases in these states within the next couple of months by following the current trend of the covid-19 infected cases.
Methodology
The total population of states will be determined by the total population of each states accordingly.
These are the constant parameters that will be used for this model:
- prog.dist.shape which is the intensity of the infection is set up to 0.5
- prog.dist.scale which is the duration of the infection is set up to 15 days
- rec.dist.shape which is the recovery intensity is kept constant to 1.5
- rec.dist.scale which is the duration recovery is kept constant for up to 35 days.
- quar.rate is also kept constant due to the execution of Restriction Order Movement in Malaysia.
Fatality parameters are also kept constant:
- fat.rate.base = 2/500
- fat.rate.overcap = 1/1000
- fat.tcoeff = 0.2
The parameters are set as assumptions according to the current trend of COVID-19 cases in Malaysia
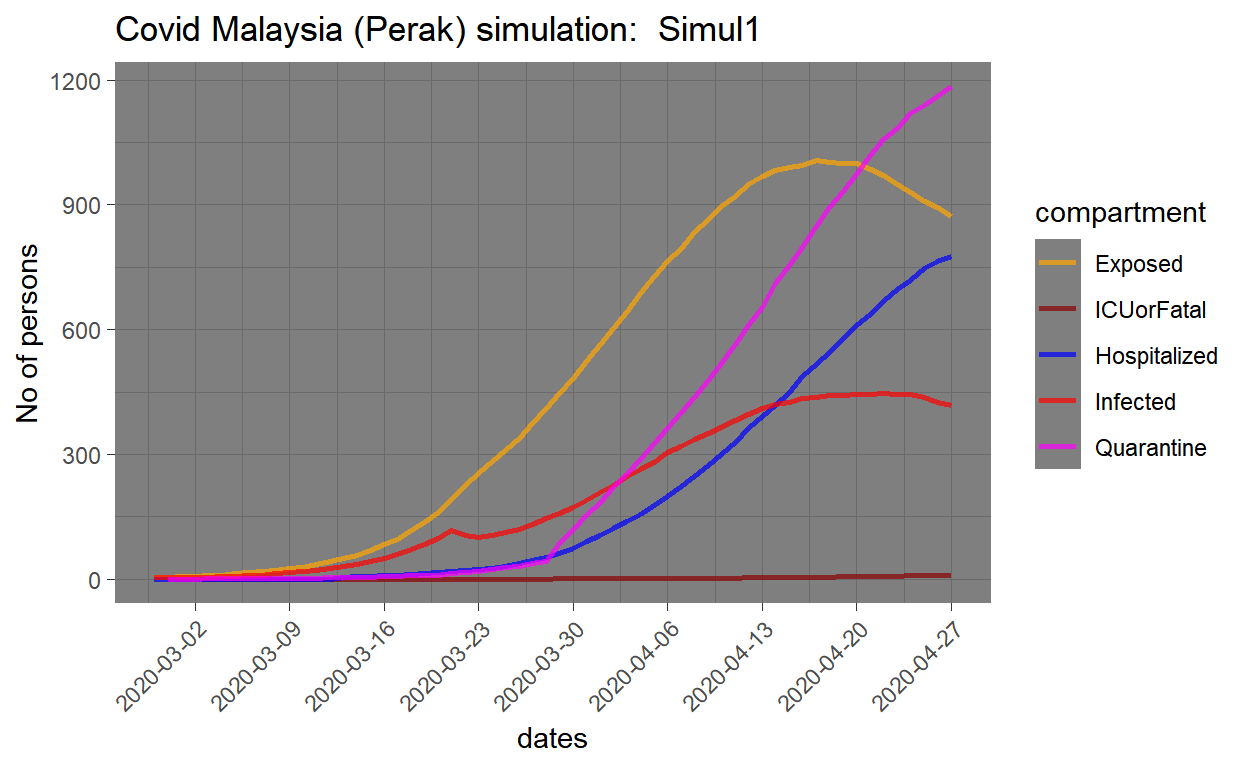
Perak
In Perak the total number of confirmed COVID-19 cases is 200 cases (as of 2nd April 2020). The hospital capacity is determined by the number of beds from the admitting hospital. For Perak, the hospital capacity is 990 beds.
The parameters to be used are as below:
The number of people infected which is the i.num is set up to 2 people infected due to the first date of cases while the s.num is set according to the total population.
The hosp.rate which is the hospital rate is at 8% as an assumption.
The number of infection, exposure is set as below:
- inf.prob.i up to 0.03. This is the probability of infections per event
- act.rate.i up to 8. This is the number of infection events
- inf.prob.e up to 0.03. This is the probability of exposure per event
- act.rate.e up to 10. This is the number of exposure events
These parameters are set as assumptions according to the infection and exposure rate in the states.
  i.num =  2, s.num = population_negeri[1] - 2,
  e.num = 0, q.num = 0,   h.num = 0,  r.num = 0, f.num = 0,
  prog.rand =  FALSE,
  prog.dist.shape = 0.5,
  prog.dist.scale = 15,
  prog.rate = 1/10,
  rec.rand = FALSE,
  rec.dist.shape =  1.5,
  rec.dist.scale = 35,
  rec.rate = 3/100,
  fat.rand =  FALSE,
  fat.rate.base = 2/500,
  fat.rate.overcap = 1/1000,
  fat.tcoeff = 0.2,
  quar.rand = FALSE,
  quar.rate = c(rep(1/10,30), rep(1/3, 335)),
  hosp.rand =  FALSE,
  hosp.rate = 8/100,
  disch.rand = FALSE,
  disch.rate =  2/100,
  inf.prob.i = 0.03, act.rate.i = 8,
  inf.prob.e = 0.03, act.rate.e = 10,
  inf.prob.q = 0.02, act.rate.q = 2.5,
  hosp.cap = 990,
  vital = FALSE,
  a.rate = 1/1000, a.prop.e = 1/1000, a.prop.i = 1/1000,
  a.prop.q = 1/1000, ds.rate = 1/1000, de.rate = 1/1000,
  di.rate = 1/1000, dq.rate = 1/1000,  dh.rate = 1/1000,
  dr.rate = 1/1000,
s_mix_ratio = 1/100 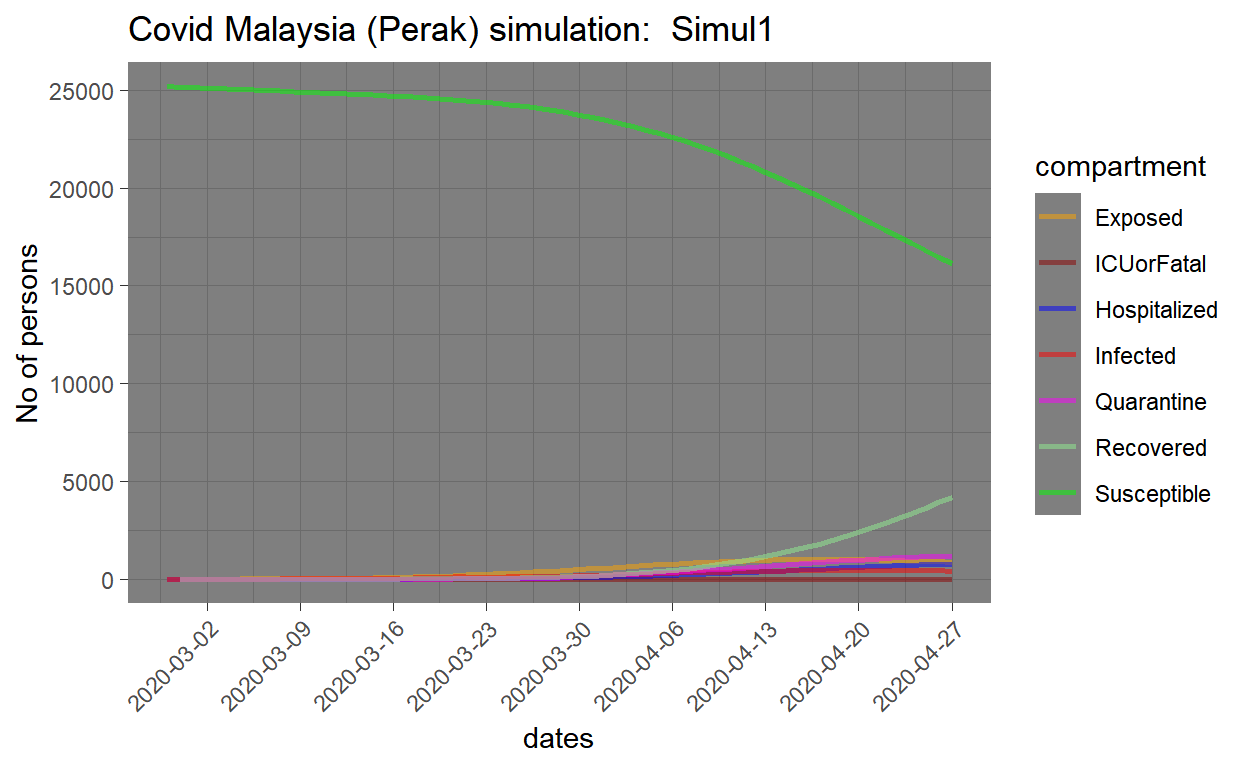
Findings
The simulated data is then compared to actual data provided by the Ministry of Health. The chosen date is from 13 March 2020 to 2 April 2020. By using the parameters, the trend of the infected cases from the simulation is almost the same as the current trend of the covid cases in Perak.
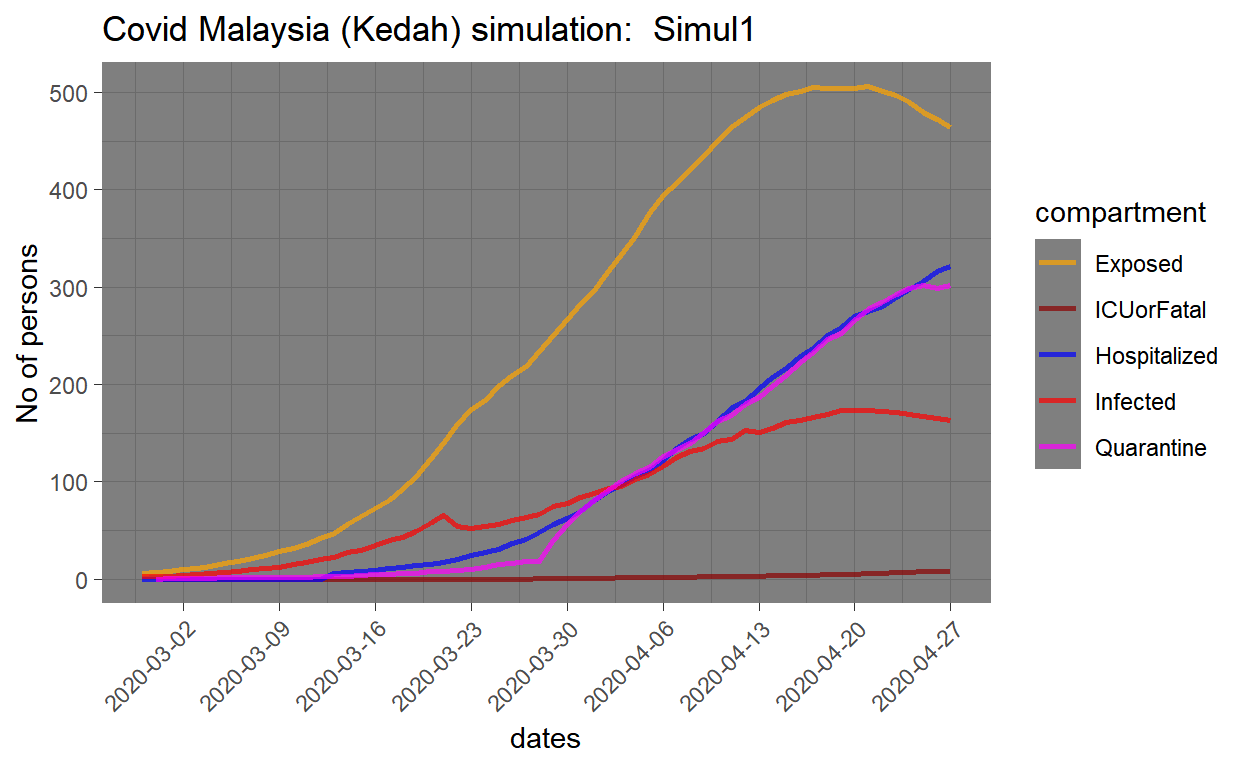
Kedah
In Kedah the total number of confirmed COVID-19 cases is 80 cases (as of 2nd April 2020). The hospital capacity is determined by the number of beds from the admitting hospital. For Kedah, the hospital capacity is 805 beds.
The parameters to be used are as below:
The number of people infected which is the i.num is set up to 2 people infected due to the first date of cases while the s.num is set according to the total population.
The hosp.rate which is the hospital rate is at 20% as an assumption.
The number of infection, exposure is set as below:
- inf.prob.i up to 0.03. This is the probability of infections per event
- act.rate.i up to 8. This is the number of infection events
- inf.prob.e up to 0.03. This is the probability of exposure per event
- act.rate.e up to 10. This is the number of exposure events
These parameters are set as assumptions according to the infection and exposure rate in the states.
  i.num =  5, s.num = population_negeri[2] - 5,
  e.num = 0, q.num = 0,   h.num = 0,  r.num = 0, f.num = 0,
  prog.rand =  FALSE,
  prog.dist.shape = 0.5,
  prog.dist.scale = 15,
  prog.rate = 1/10,
  rec.rand = FALSE,
  rec.dist.shape =  1.5,
  rec.dist.scale = 35,
  rec.rate = 0.003,
  fat.rate.base = 2/500,
  fat.rate.overcap = 1/1000,
  fat.tcoeff = 0.2,
  quar.rand = FALSE,
  quar.rate = c(rep(1/10,30), rep(1/3, 335)),
  hosp.rand =  FALSE,
  hosp.rate = 20/100,
  disch.rand = FALSE,
  disch.rate =  20/100,
  inf.prob.i = 0.03, act.rate.i = 8,
  inf.prob.e = 0.03, act.rate.e = 10,
  inf.prob.q = 0.02, act.rate.q = 2.5,
  hosp.cap = 805,
  vital = FALSE,
  a.rate = 1/1000, a.prop.e = 1/1000, a.prop.i = 1/1000,
  a.prop.q = 1/1000, ds.rate = 1/1000, de.rate = 1/1000,
  di.rate = 1/1000, dq.rate = 1/1000,  dh.rate = 1/1000,
  dr.rate = 1/1000,
s_mix_ratio = 1/100 
Findings
The simulated data is then compared to actual data provided by the Ministry of Health. The chosen date is from 13 March 2020 to 2 April 2020. By using the parameters, the trend of the infected cases from the simulation is almost the same as the current trend of the covid cases in Kedah.
Penang
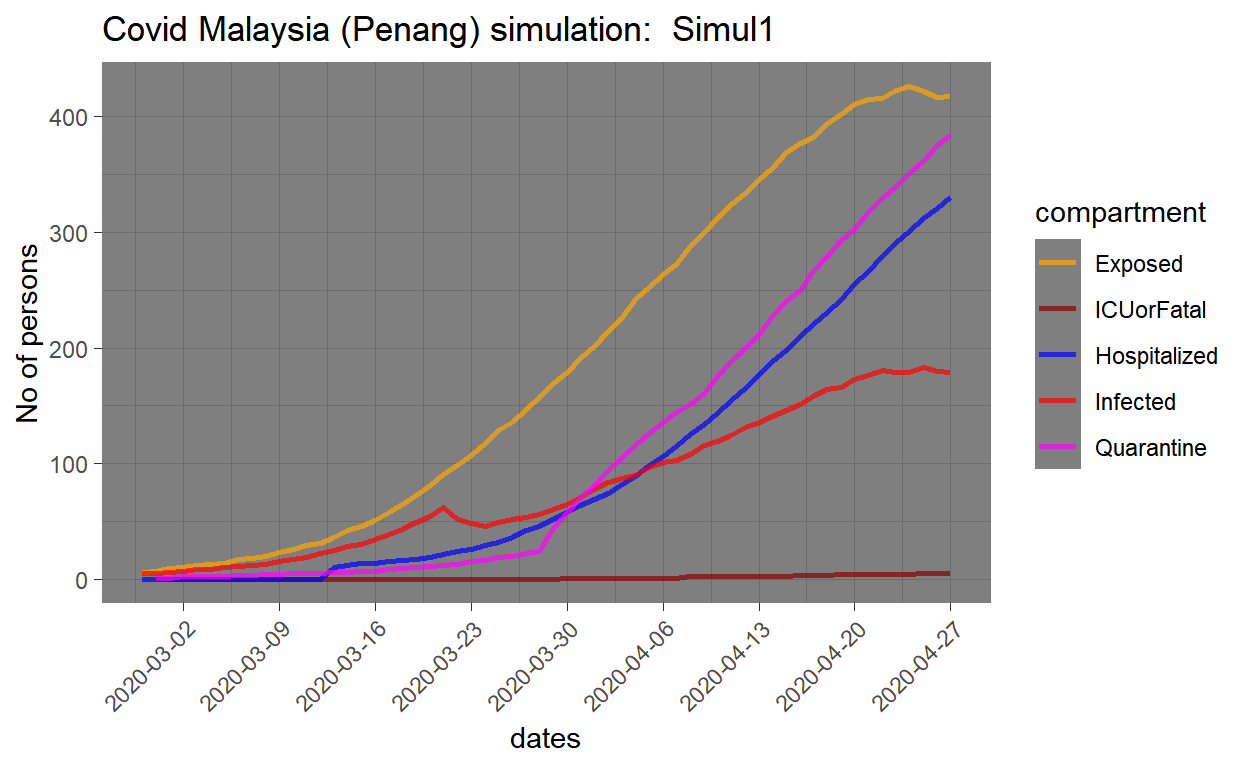
In Penang the total number of confirmed COVID-19 cases is 98 cases (as of 2nd April 2020). The hospital capacity is determined by the number of beds from the admitting hospital. For Penang, the hospital capacity is 1090 beds.
The parameters to be used are as below:
The number of people infected which is the i.num is set up to 2 people infected due to the first date of cases while the s.num is set according to the total population.
The hosp.rate which is the hospital rate is at 10% as an assumption.
The number of infection, exposure is set as below:
- inf.prob.i up to 0.02. This is the probability of infections per event
- act.rate.i up to 7. This is the number of infection events
- inf.prob.e up to 0.03. This is the probability of exposure per event
- act.rate.e up to 10 This is the number of exposure events
These parameters are set as assumptions according to the infection and exposure rate in the states.
  i.num =  7, s.num = 300000 - 7,
  e.num = 0, q.num = 0,   h.num = 0,  r.num = 0, f.num = 0,
  prog.rand =  FALSE,
  prog.dist.shape = 0.5,
  prog.dist.scale = 15,
  prog.rate = 1/10,
  rec.rand = FALSE,
  rec.dist.shape =  1.5,
  rec.dist.scale = 35,
  rec.rate = 3/100,
  fat.rand =  FALSE,
  fat.rate.base = 2/500,
  fat.rate.overcap = 1/1000,
  fat.tcoeff = 0.2,
  quar.rand = FALSE,
  quar.rate = c(rep(1/10,30), rep(1/3, 335)),
  hosp.rand =  FALSE,
  hosp.rate = 10/100,
  disch.rand = FALSE,
  disch.rate =  2/100,
  inf.prob.i = 0.02, act.rate.i = 7,
  inf.prob.e = 0.03, act.rate.e = 10,
  inf.prob.q = 0.02, act.rate.q = 2.5,
  hosp.cap = 1090,
  vital = FALSE,
  a.rate = 1/1000, a.prop.e = 1/1000, a.prop.i = 1/1000,
  a.prop.q = 1/1000, ds.rate = 1/1000, de.rate = 1/1000,
  di.rate = 1/1000, dq.rate = 1/1000,  dh.rate = 1/1000,
  dr.rate = 1/1000,
  s_mix_ratio = 1/100  # HERE assume that not all S are in direct touch with infected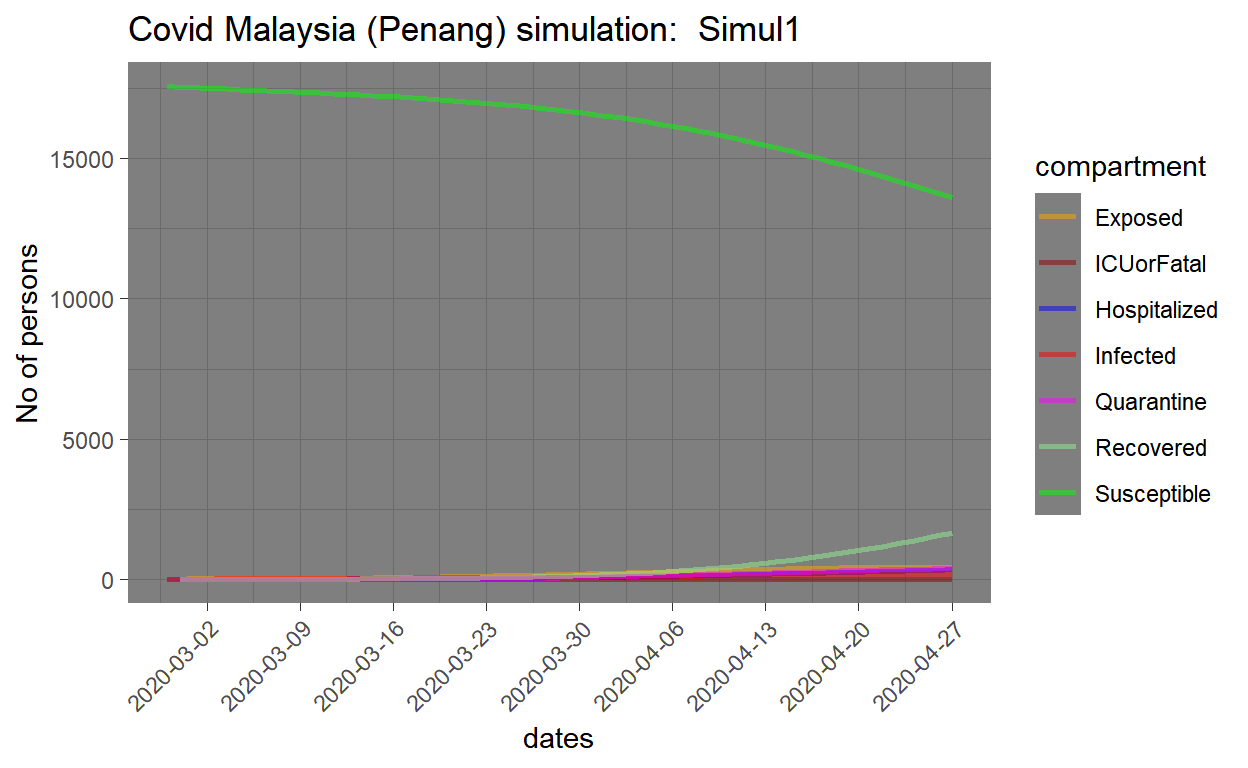
Findings
The simulated data is then compared to actual data provided by the Ministry of Health. The chosen date is from 13 March 2020 to 2 April 2020. By using the parameters, the trend of the infected cases from the simulation is almost the same as the current trend of the covid cases in Penang.
Perlis
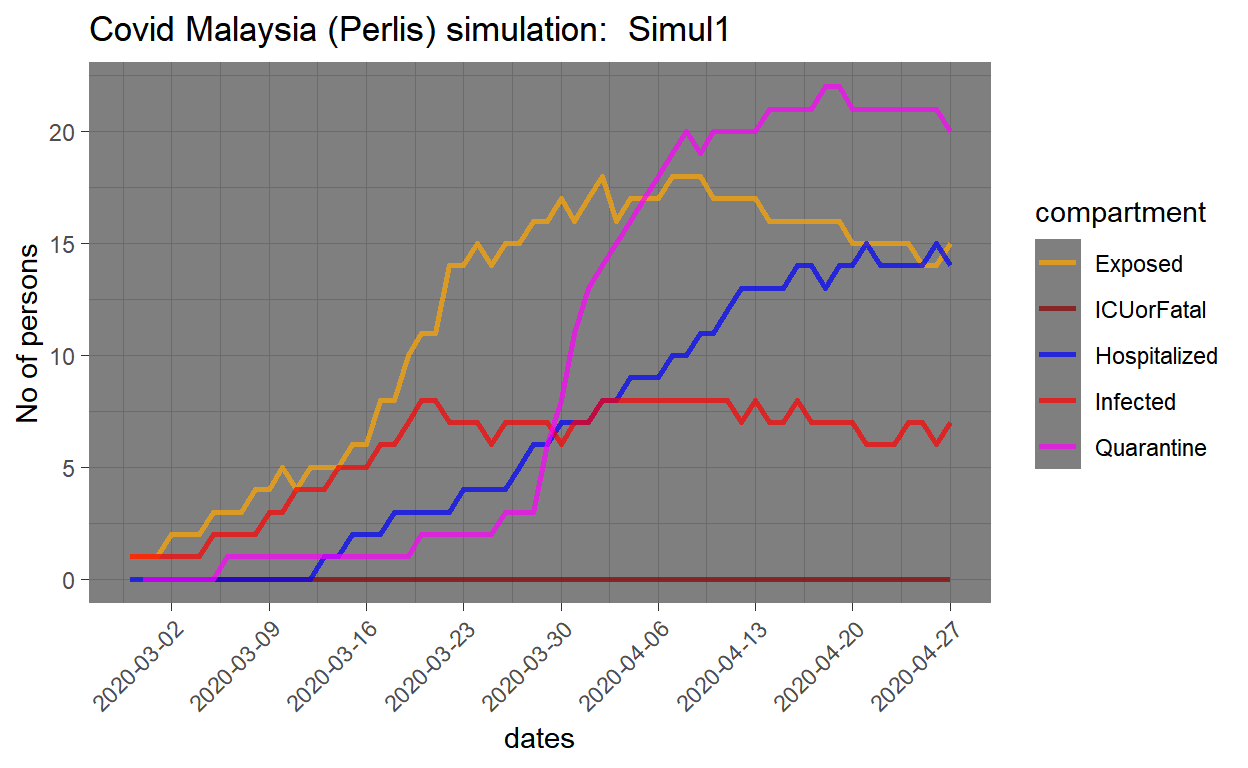
In Perlis the total number of confirmed COVID-19 cases is 12 cases (as of 2nd April 2020). The hospital capacity is determined by the number of beds from the admitting hospital. For Perlis, the hospital capacity is 400 beds.
The parameters to be used are as below:
The number of people infected which is the i.num is set up to 1 people infected due to the first date of cases while the s.num is set according to the total population.
The hosp.rate which is the hospital rate is at 8% as an assumption.
The number of infection, exposure is set as below:
- inf.prob.i up to 0.03. This is the probability of infections per event
- act.rate.i up to 9. This is the number of infection events
- inf.prob.e up to 0.02. This is the probability of exposure per event
- act.rate.e up to 10. This is the number of exposure events
These parameters are set as assumptions according to the infection and exposure rate in the states.
  i.num =  1, s.num = population_negeri[4] - 1,
  e.num = 0, q.num = 0,   h.num = 0,  r.num = 0, f.num = 0,
  prog.rand =  FALSE,
  prog.dist.shape = 0.5,
  prog.dist.scale =  15,
  prog.rate = 1/10,
  rec.rand = FALSE,
  rec.dist.shape =  1.5,
  rec.dist.scale = 35,
  rec.rate = 1/100,
  fat.rand =  FALSE,
  fat.rate.base = 2/500,
  fat.rate.overcap = 1/1000,
  fat.tcoeff = 0.2,
  quar.rand = FALSE,
  quar.rate = c(rep(1/10,30), rep(1/3, 335)),
  hosp.rand =  FALSE,
  hosp.rate = 8/100,
  disch.rand = FALSE,
  disch.rate =  2/100,
  inf.prob.i = 0.03, act.rate.i =  9,
  inf.prob.e = 0.02, act.rate.e =  10,
  inf.prob.q = 0.02, act.rate.q =   2.5,
  hosp.cap = 400,
  vital = FALSE,
  a.rate = 1/1000, a.prop.e = 1/1000, a.prop.i = 1/1000,
  a.prop.q = 1/1000, ds.rate = 1/1000, de.rate = 1/1000,
  di.rate = 1/1000, dq.rate = 1/1000,  dh.rate = 1/1000,
  dr.rate = 1/1000,
  out="mean",
s_mix_ratio = 1/10 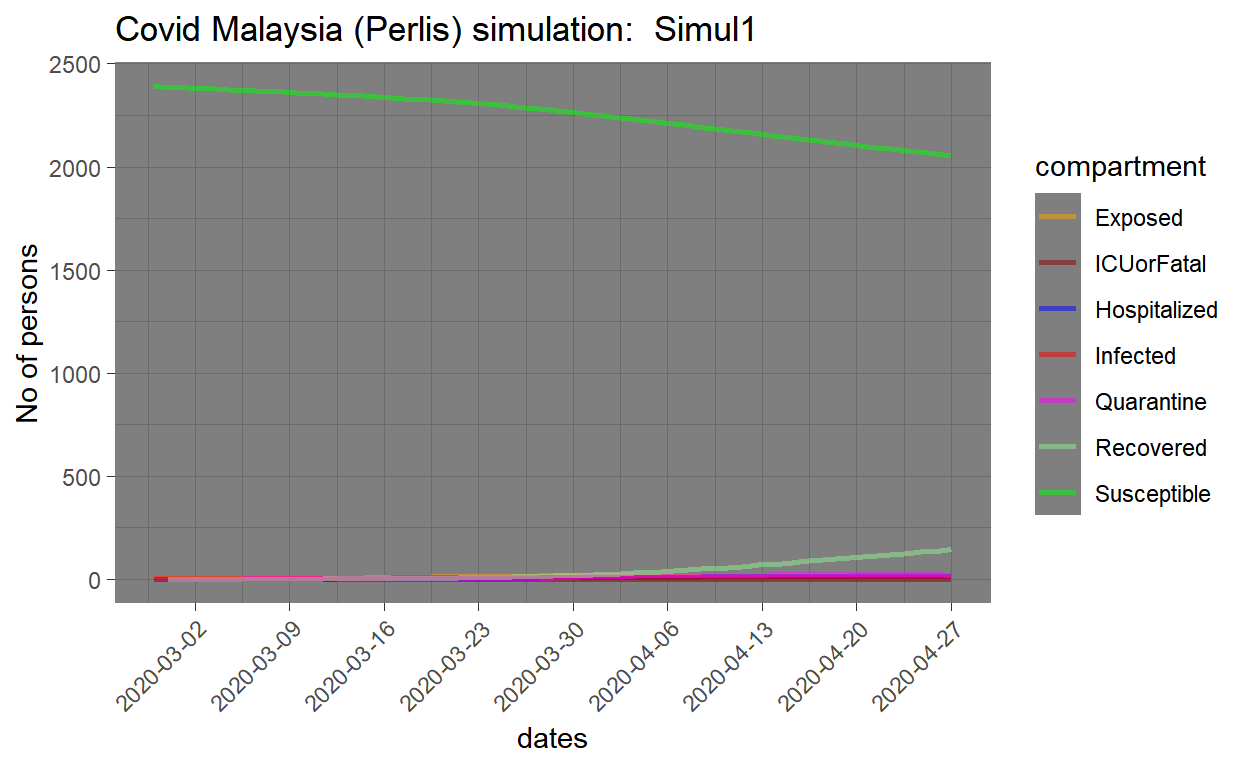
Findings
The simulated data is then compared to actual data provided by the Ministry of Health. The chosen date is from 13 March 2020 to 2 April 2020. By using the parameters, the trend of the infected cases from the simulation is almost the same as the current trend of the covid cases in Perlis.
References
- Worldpop. “WorldPop.” Worldpop, https://www.worldpop.org/.
- “GADM Maps and Data.” GADM, https://gadm.org/.
- Hospital Screening Centre in Malaysia. http://www.moh.gov.my/moh/resources/Penerbitan/Garis%20Panduan/COVID19/Annex_3_Screening_centre_24032020.pdf
- Public Hospitals in Perlis, http://hospital.com.my/directory/Perlis/public/index.htm.
- Public Hospitals in Perak, http://hospital.com.my/directory/Perak/public/index.htm.
- Public Hospitals in Penang, http://hospital.com.my/directory/Penang/public/index.htm.
- Public Hospitals in Kedah, http://hospital.com.my/directory/Kedah/public/index.htm.
- Account, KKMPutrajayaVerified. “KKMPutrajaya (@KKMPutrajaya).” Twitter, Twitter, 25 Mar. 2020, https://twitter.com/KKMPutrajaya.
- Facebook Data For Good, https://dataforgood.fb.com/tools/population-density-maps/
- Evozi. “COVID-19: Malaysia Outbreak Monitor: Live Updates.” COVID-19 | Malaysia Outbreak Monitor | Live Updates, https://www.outbreak.my/.