Table of Contents
Introduction
This is a technical study on COVID-19 infected cases on a few selected states in Malaysia which are Terengganu, Kelantan and Pahang. The objective of this study is to simulate the susceptible cases, exposed cases, infected cases, hospitalized cases as well as recovered cases within the next couple of months in Malaysia by following the current trend of the covid-19 infected cases.
Methodology
The method chosen to obtain the s.num (susceptible) are as follow.
Percentage of Tabligh Participants that are tested positive against the total participants from the respective state as of 19th March 2020 that was reported by Berita Harian are doubled considering that the total number of Tabligh Participants that have been declared positive has also doubled at the time of writing. The percentage is then multiplied by the total population in the chosen are to get the approximate susceptible population.
The total population of states will be determined by the total population district of which the current covid-19 cases are high and covered most of total cases.
These are the constant parameters to be set:
- prog.dist.shape is set to 0.5 which is the intensity of the infection
- prog dist.scale is set to 15 which is the duration of the infection
- rec.dist.shape which is the recovery intensity is kept constant to 1.5
- rec.dist.scale which is the duration recovery is kept constant for up to 35 days.
- quar.rate is also kept constant due to the execution of Restriction Order Movement in Malaysia.
- i.num was fixed to 1 for all States
- s_mix_ratio was fixed to 1/100
Fatality parameters are also kept constant:
- fat.rate.base = 1.5/500
- fat.rate.overcap = 1/1000
- fat.tcoeff = 0.2
The paramaters are set as assumptions according to the current trend of COVID-19 cases in Malaysia.
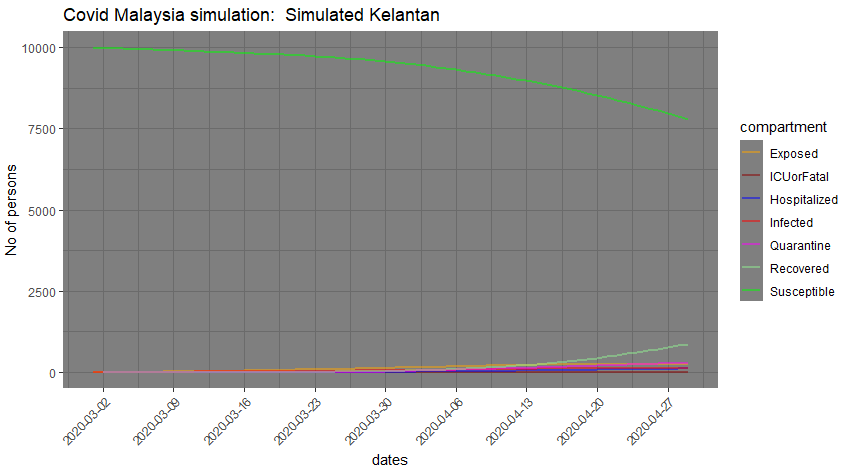
Kelantan
The population for this state is taken from Kelantan most density area which is Kota Bharu (62% of Kelantan’s Cases as of 31st March 2020) where by the population sample is set for up to 40,000 population.
The number of people infected which is the i.num is set up to 1 people infected while the s.num is set at 40,000 total population.The hospital capacity is set at 1,562 beds following the admitting hospital capacity.
The hosp.rate which is the hospital rate is set to be 5% as an assumption.
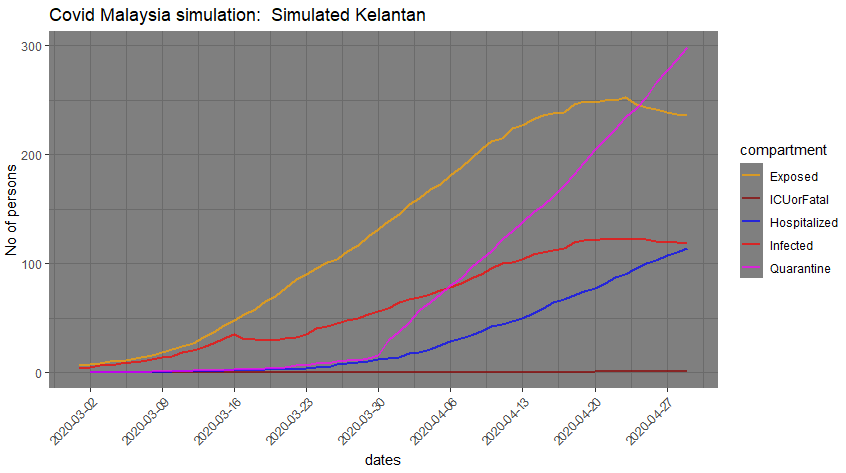
The number of infection, expose is set as below:
- inf.prob.i up to 0.04. This is the infection rate for the infected
- act.rate.i up to 6. This is number of which the infection may get infected to people
- inf.prob.e up to 0.04. This is the infection rate to expose
- act.rate.e up to 5 This is number of which the infection may get expose to people
These paramaters are set as assumptions according to the infection and expose rate in the states which is relatively moderate
Findings
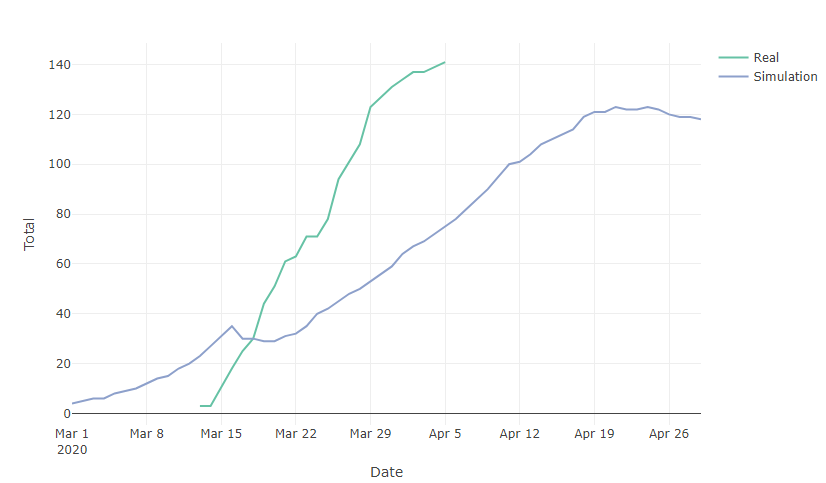
By using the parameters, the trend of the infected cases from the simulation is almost the same as the current trend of the covid cases in Kelantan, where by on 2nd April 2020 the infected cases from the current trend is up to 134 cases where by in the simulation trend the infected cases are at a similar rate which are about 84 number of people infected. This shows a late peak following the trend of infected cases. Below are the comparison between simulation trend and real trend.
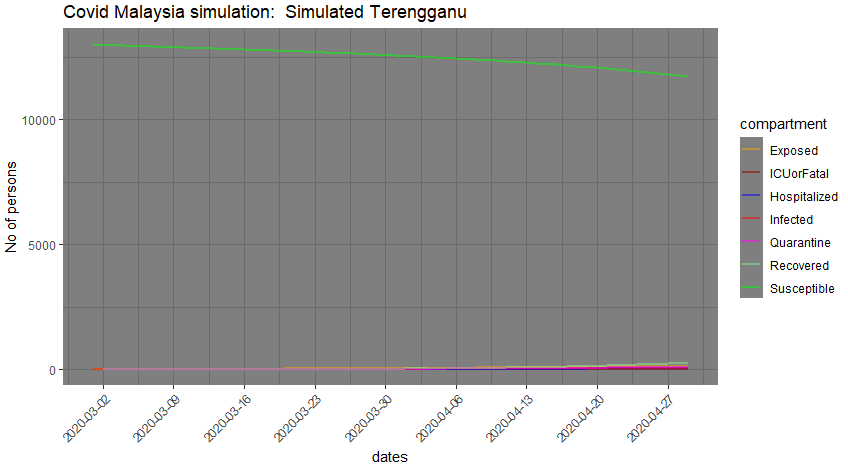
Terengganu
The population for this state is taken from Terengganu most density area which is Besut and Kuala Terengganu (70% of Terengganu’s Cases as of 31st March 2020) where by the population sample is set for up to 13,000 population.
The s.num is set at 13,000 total population. The hospital capacity is set at 1,011 beds following the admitting hospital capacity.
The hosp.rate which is the hospital rate is set to be 5% as an assumption.
The number of infection, expose is set as below:
- inf.prob.i up to 0.035. This is the infection rate for the infected
- act.rate.i up to 6. This is number of which the infection may get infected to people
- inf.prob.e up to 0.035. This is the infection rate to expose
- act.rate.e up to 5 This is number of which the infection may get expose to people
These paramaters are set as assumptions according to the infection and expose rate in the states which is relatively slow
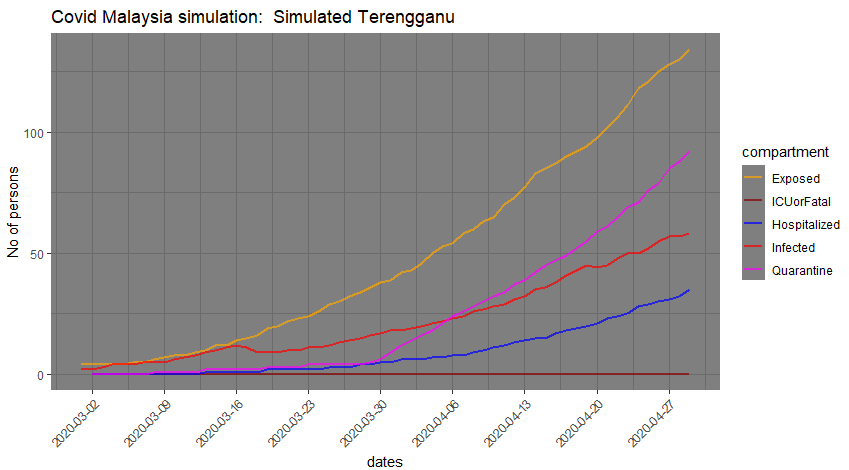
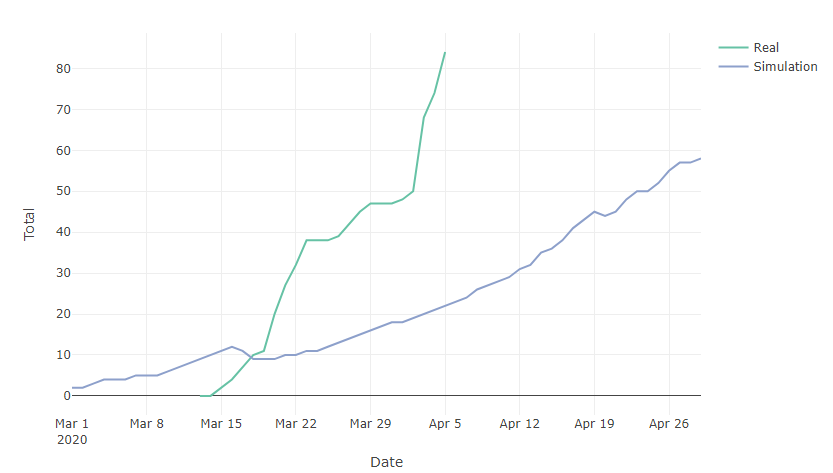
Findings
By using the parameters, the trend of the infected cases from the simulation is almost the same as the current trend of the covid cases in Terengganu, where by on 2nd April 2020 the infected cases from the current trend is up to 50 cases where by in the simulation trend the infected cases are at a similar rate which are about 22 number of people infected. This shows a late peak following the trend of infected cases. Below are the comparison between simulation trend and real trend.
Pahang
The population for this state is taken from Terengganu most density area which is Bera, Jerantut, Kuantan, Pekan (80% of Pahang’s Cases as of 31st March 2020) where by the population sample is set for up to 700,000 population. The hospital capacity is set at 1008 beds following the admitting hospital capacity.
The s.num is set at 40,000 total population. The hosp.rate which is the hospital rate is set to be 5% as an assumption.
The number of infection, expose is set as below:
- inf.prob.i up to 0.038. This is the infection rate for the infected
- act.rate.i up to 6. This is number of which the infection may get infected to people
- inf.prob.e up to 0.038. This is the infection rate to expose
- act.rate.e up to 6 This is number of which the infection may get expose to people
These paramaters are set as assumptions according to the infection and expose rate in the states which is relatively moderate
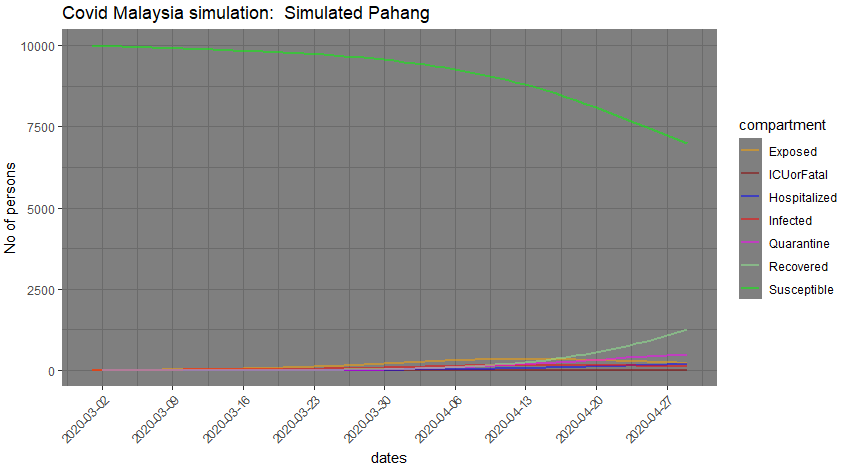
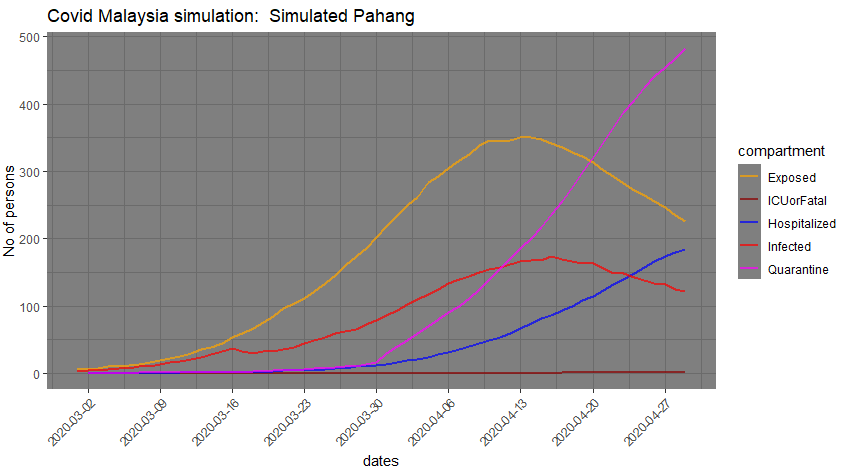
Findings
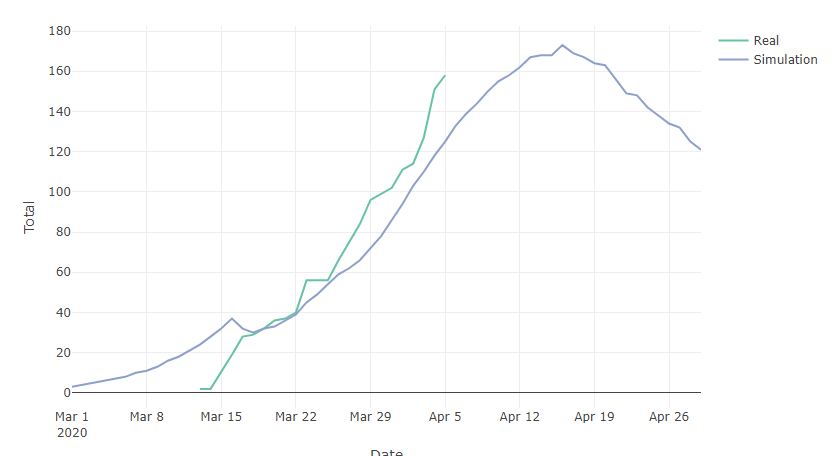
By using the parameters, the trend of the infected cases from the simulation is almost the same as the current trend of the covid cases in Pahang where by on 2nd April 2020 the infected cases from the current trend is up to 114 cases where by in the simulation trend the infected cases are at a similar rate which are about 98 number of people infected. Below are the comparison between simulation trend and real trend.
References
- Worldpop. “WorldPop.” Worldpop, https://www.worldpop.org/.
- “GADM Maps and Data.” GADM, https://gadm.org/.
- Hospital Screening Centre in Malaysia. http://www.moh.gov.my/moh/resources/Penerbitan/Garis%20Panduan/COVID19/Annex_3_Screening_centre_24032020.pdf
- Public Hospitals in Kelantan, http://hospital.com.my/directory/Kelantan/public/index.htm.
- Public Hospitals in Terengganu, http://hospital.com.my/directory/Terengganu/public/index.htm.
- Public Hospitals in Pahang, http://hospital.com.my/directory/Pahang/public/index.htm.
- Account, KKMPutrajayaVerified. “KKMPutrajaya (@KKMPutrajaya).” Twitter, Twitter, 25 Mar. 2020, https://twitter.com/KKMPutrajaya.
- Evozi. “COVID-19: Malaysia Outbreak Monitor: Live Updates.” COVID-19 | Malaysia Outbreak Monitor | Live Updates, https://www.outbreak.my/.
- Berita Harian, https://www.bharian.com.my/berita/nasional/2020/03/666730/covid-19-10553-jemaah-tabligh-diperiksa-513-positif