Table of Contents
Introduction
This is a technical study on COVID-19 infected cases on a few selected states in Malaysia which are Selangor, Kuala Lumpur and Putrajaya. The objective of this study is to simulate the susceptible cases, exposed cases, infected cases, hospitalized cases as well as recovered cases within the next couple of months in Malaysia by following the current trend of the covid-19 infected cases.
Methodology
The total population of states will be determined by the total population district of which the current covid-19 cases are high and covered up to 80% of total cases.
These are the constant parameters that will be used for this model:
- prog.dist.shape which is the intensity of the infection is set up to 0.5
- prog.dist.scale which is the duration of the infection is set up to 15 days
- rec.dist.shape which is the recovery intensity is kept constant to 1.5
- rec.dist.scale which is the duration recovery is kept constant for up to 35 days.
- quar.rate is also kept constant due to the execution of Restriction Order Movement in Malaysia.
Fatality parameters are also kept constant:
- fat.rate.base = 2/500
- fat.rate.overcap = 1/1000
- fat.tcoeff = 0.2
The paramaters are set as assumptions according to the current trend of COVID-19 cases in Malaysia.
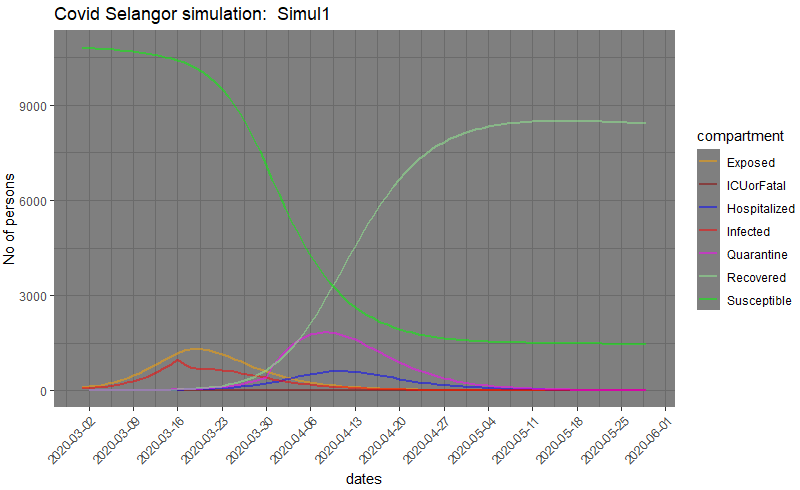
Selangor
In Selangor the total number of confirmed COVID-19 cases is 726 cases (as of 1st April 2020) with the main district Hulu Langat, Gombak, Klang and Petaling. The total population of the high density district will be taken into the simulation which are about 3 million population. The hospital capacity is determined by the number of beds from the admitting hospital which is Hospital Sungai Buloh with a capacity of 620 beds.
The parameters to be used are as below:
The number of people infected which is the i.num is set up to 5 people infected due to high density of covid cases in this state while the s.num is set at 3,247,525 total population.
The hosp.rate which is the hospital rate is at 4% as an assumption.
The number of infection, expose is set as below:
- inf.prob.i up to 0.045. This is the infection rate for the infected
- act.rate.i up to 7. This is number of which the infection may get infected to people
- inf.prob.e up to 0.045. This is the infection rate to expose
- act.rate.e up to 6 This is number of which the infection may get expose to people
These paramaters are set as assumptions according to the infection and expose rate in the states.
  i.num =  5, s.num = 3247527 - 5,
  e.num = 0, q.num = 0,   h.num = 0,  r.num = 0, f.num = 0,
  prog.rand =  FALSE,
  prog.dist.shape = 0.5,
  prog.dist.scale =  15,
  prog.rate = 20/100,
  rec.rand = FALSE,
  rec.dist.shape =  1.5,
  rec.dist.scale = 35,
  rec.rate = 1/100,
  fat.rand =  FALSE,
  fat.rate.base = 2/500,
  fat.rate.overcap = 1/1000,
  fat.tcoeff = 0.2,
  quar.rand = FALSE,
  quar.rate = c(rep(1/10,30), rep(1/3, 335)),
  hosp.rate = 4/100,
  disch.rand = FALSE,
  disch.rate =  0.5/100,
  inf.prob.i = 0.045, act.rate.i =  7,
  inf.prob.e = 0.045, act.rate.e =  7,
  inf.prob.q = 0.05, act.rate.q =   3,
  hosp.cap = 620,
  vital = FALSE,
  a.rate = 1/1000, a.prop.e = 1/1000, a.prop.i = 1/1000,
  a.prop.q = 1/1000, ds.rate = 1/1000, de.rate = 1/1000,
  di.rate = 1/1000, dq.rate = 1/1000,  dh.rate = 1/1000,
  dr.rate = 1/1000,
  s_mix_ratio = 1/300,
  s.num = round(s.num*s_mix_ratio,0) - i.num
Below are the results:

Findings
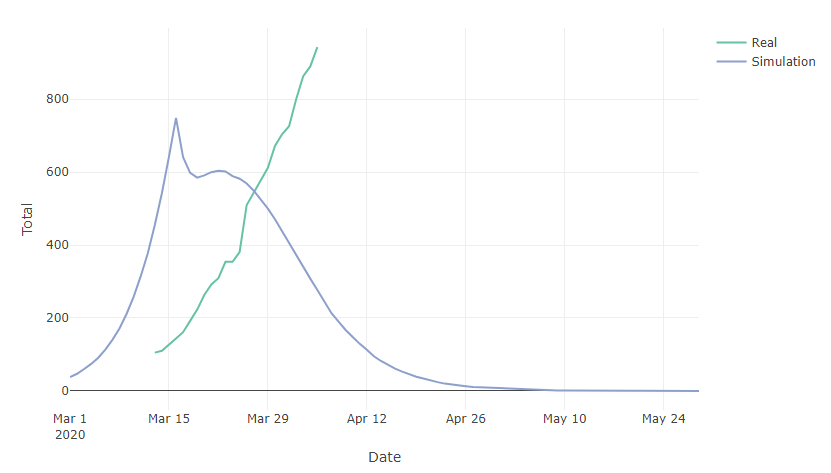
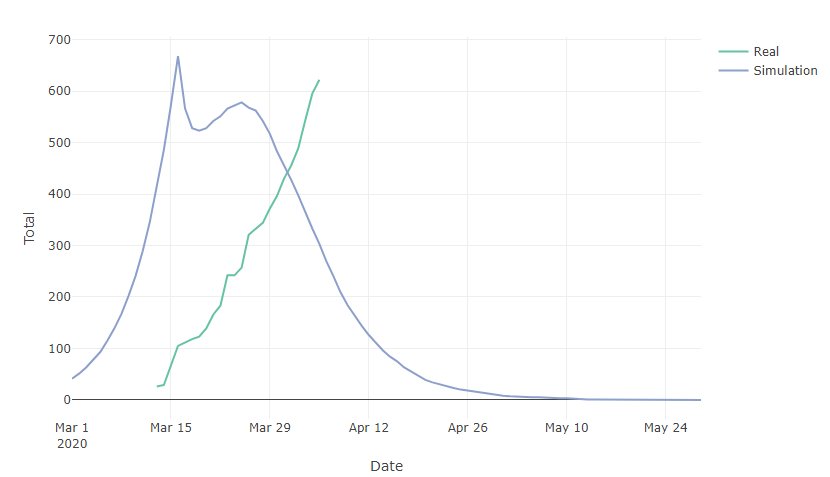
By using the parameters, the trend of the infected cases from the simulation is almost the same the current trend of the covid cases in Selangor, where by on 2nd April 2020 the infected cases from the current trend is up to almost 800 cases where by in the simulation trend the infected cases peaked at an earlier rate where there are over 749 cases infected.
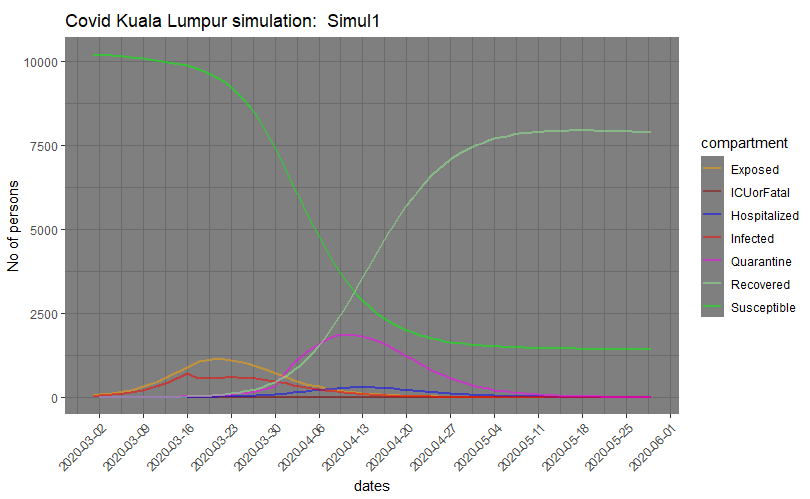
Kuala Lumpur
In Kuala Lumpur the total number of confirmed COVID-19 cases is 455 cases (as of 1st April 2020) with the main district Cheras, Kepong, Lembah Pantai, Titiwangsa. The total population of the high density district will be taken into the simulation which are about 510,000 total population. The hospital capacity is determined by the number of beds from the admitting hospital which is Hospital Kuala Lumpur with a capacity of 2,300 beds. However, the beds of COVID-19 cases is set up to 800 beds.
The number of people infected which is the i.num is set up to 5 people infected due to high density of covid cases in this state while the s.num is set at 510,996 total population.
The hosp.rate which is the hospital rate is at 2% as an assumption.
The number of infection, expose is set as below:
- inf.prob.i up to 0.045. This is the infection rate for the infected
- act.rate.i up to 6. This is number of which the infection may get infected to people
- inf.prob.e up to 0.045. This is the infection rate to expose
- act.rate.e up to 6. This is number of which the infection may get expose to people
These paramaters are set as assumptions according to the infection and expose rate in the states.
  i.num = 5, s.num = 510996 - 5,
  e.num = 0, q.num = 0,   h.num = 0,  r.num = 0, f.num = 0,
  prog.rand =  FALSE,
  prog.dist.shape = 0.5,
  prog.dist.scale =  15,
  prog.rate = 20/100,
  rec.rand = FALSE,
  rec.dist.shape =  1.5,
  rec.dist.scale = 35,
  rec.rate = 0.5/100,
  fat.rand =  FALSE,
  fat.rate.base = 2/500,
  fat.rate.overcap = 1/1000,
  fat.tcoeff = 0.2,
  quar.rand = FALSE,
  quar.rate = c(rep(1/10,30), rep(1/3, 335)),
  hosp.rand =  FALSE,
  hosp.rate = 2/100,
  disch.rand = FALSE,
  disch.rate =  0.2/100,
  inf.prob.i = 0.045, act.rate.i =  6,
  inf.prob.e = 0.045, act.rate.e =  6,
  inf.prob.q = 0.05, act.rate.q =   3,
  hosp.cap = 800,
  vital = FALSE,
  a.rate = 1/1000, a.prop.e = 1/1000, a.prop.i = 1/1000,
  a.prop.q = 1/1000, ds.rate = 1/1000, de.rate = 1/1000,
  di.rate = 1/1000, dq.rate = 1/1000,  dh.rate = 1/1000,
  dr.rate = 1/1000,
  s_mix_ratio = 1/50,
  s.num = round(s.num*s_mix_ratio,0) - i.num
Below are the results:
Findings
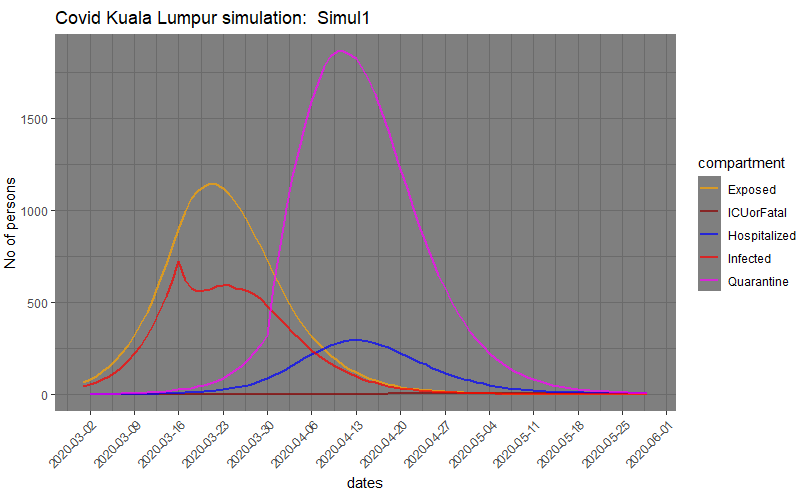
By using the parameters, the trend of the infected cases from the simulation is almost the same the current trend of the covid cases in Kuala Lumpur, where by on 2th April 2020 the infected cases from the current trend is up to 488 cases where by in the simulation trend the infected cases are at a similar rate which is at 415 number of people infected.
Putrajaya
Putrajaya has a total population of 80000 people. Therefore, the total population of putrajaya will be taken into simulation. The number of hospital capacity is set up to only 250 beds. This is an assumption made from sharing the same admitting hospital in Kuala Lumpur.
The number of people infected which is the i.num is set up to 1 people infected due to high density of covid cases in this state while the s.num is set at 80,000 total population.
The hosp.rate which is the hospital rate is at 2% as an assumption.
The number of infection, expose is set as below: * inf.prob.i up to 0.045. This is the infection rate for the infected * act.rate.i up to 6. This is number of which the infection may get infected to people * inf.prob.e up to 0.045. This is the infection rate to expose * act.rate.e up to 7 This is number of which the infection may get expose to people
These paramaters are set as assumptions according to the infection and expose rate in the states.
  i.num =  1, s.num = 80000 - 1,
  e.num = 0, q.num = 0,   h.num = 0,  r.num = 0, f.num = 0,
  prog.rand =  FALSE,
  prog.dist.shape = 0.5,
  prog.dist.scale =  15,
  prog.rate = 5/100,
  rec.rand = FALSE,
  rec.dist.shape =  1.5,
  rec.dist.scale = 35,
  rec.rate = 1/100,
  fat.rand =  FALSE,
  fat.rate.base = 1/500,
  fat.rate.overcap = 1/1000,
  fat.tcoeff = 0.2,
  quar.rand = FALSE,
  quar.rate = c(rep(1/10,30), rep(1/3, 335)),
  hosp.rand =  FALSE,
  hosp.rate = 2/100,
  disch.rand = FALSE,
  disch.rate =  1/100,
  inf.prob.i = 0.035, act.rate.i =  6,
  inf.prob.e = 0.035, act.rate.e =  7,
  inf.prob.q = 0.01, act.rate.q =   2,
  hosp.cap = 250,
  vital = FALSE,
  a.rate = 1/1000, a.prop.e = 1/1000, a.prop.i = 1/1000,
  a.prop.q = 1/1000, ds.rate = 1/1000, de.rate = 1/1000,
  di.rate = 1/1000, dq.rate = 1/1000,  dh.rate = 1/1000,
  dr.rate = 1/1000,
  s_mix_ratio = 1/5
  s.num = round(s.num*s_mix_ratio,0) - i.num
Below are the results:
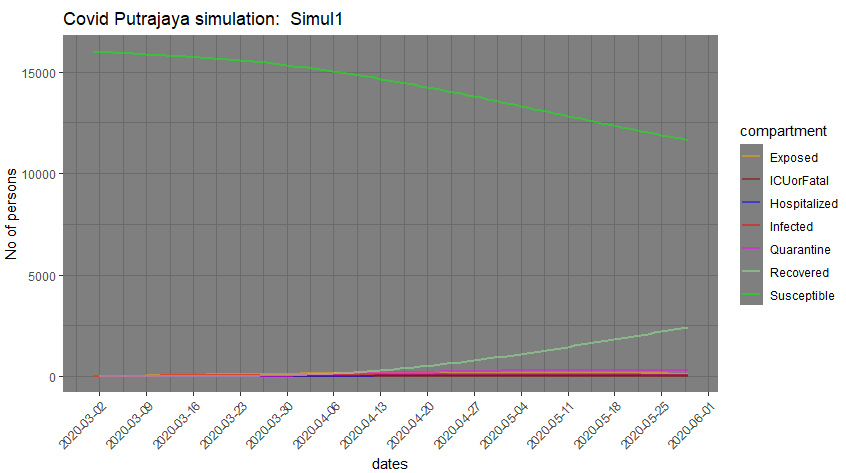

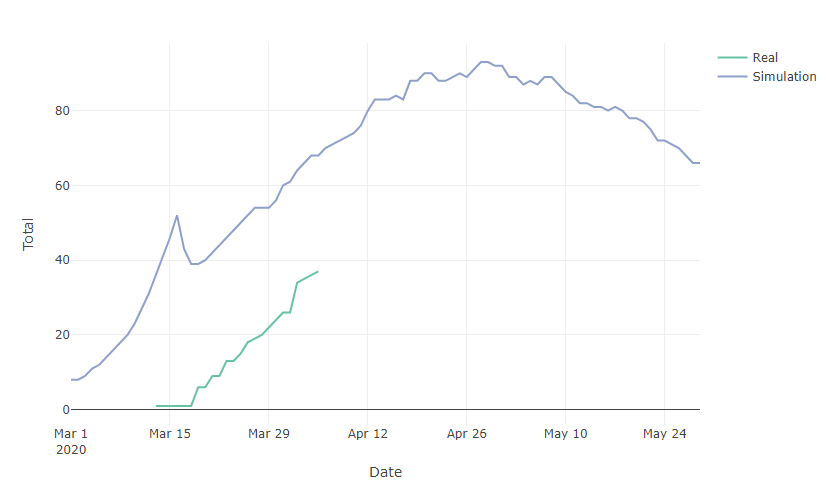
Findings
By using the parameters, the trend of the infected cases from the simulation is almost the same the current trend of the covid cases in Putrajaya, where by on 2nd April 2020 the infected cases from the current trend is up to 34 cases where by in the simulation trend the infected cases are at a rate which are about 64 number of people infected. Below are the comparison between simulation trend and real trend.
References
- Worldpop. “WorldPop.” Worldpop, https://www.worldpop.org/.
- “GADM Maps and Data.” GADM, https://gadm.org/.
- Hospital Screening Centre in Malaysia. http://www.moh.gov.my/moh/resources/Penerbitan/Garis%20Panduan/COVID19/Annex_3_Screening_centre_24032020.pdf
- Public Hospitals in Kuala Lumpur, http://hospital.com.my/directory/Kuala_Lumpur/public/index.htm.
- Public Hospitals in Selangor, http://hospital.com.my/directory/Selangor/public/index.htm.
- Account, KKMPutrajayaVerified. “KKMPutrajaya (@KKMPutrajaya).” Twitter, Twitter, 25 Mar. 2020, https://twitter.com/KKMPutrajaya.
- Evozi. “COVID-19: Malaysia Outbreak Monitor: Live Updates.” COVID-19 | Malaysia Outbreak Monitor | Live Updates, http://www.outbreak.my/.