Table of Contents
Pre-amble
PKP resulted from Covid-19 epidemic requires us to alter our behavior in regards to mobility and human interactions, in particular physical interactions. The situation demands us as a community to perform self-restraint process. What we have learned from the Covid epidemic is that as humans, we had become “extremely dense and highly connected” - which is essentially part of our daily life. The essentiality of life requires us to be connected and in the process, our society became dense.
We need to continue our connectivities since it is the essence of our economic activities, but at the same time, we need/want to reduce the total risk of us as society as a whole from disasters, such as disease epidemics of Covid-19. While Covid-19 will eventually become part of history, future risks of pandemics are ever-present and close to us all.
We all must agree as we are going back to our “normal”, a new normal must be established. This new normal is “human distancing” norms. What it means is we need to continue to be connected as our daily activities are demanded from us, but a “small but significant change”, that is we reduce any non-essentials and unnecessary activities (which are wasteful) as much as possible. This small but significant change, if undertaken by a large majority of the people, would bring the risk down tremendously.
How this concept of “human distancing” can be achieved in a society, and what it means in terms of risk reduction? This is the purpose of this writing.
Human contact network
In studies of the human contact network, it is being posited that it follows a power-law distribution. Power law poses major issues, namely the volatility of estimates is severe. It has been documented that for networks with a power-law exponent \(\tau < 3\), any active transmissions can survive for a time exponential in the network size regardless of the transmission rate. If \(\tau > 3\), however, for sufficiently small transmission rate, the time to extinction is at most polynomial in the network size.1
There are “two networks” which are interplay when comes to contact network. One is the “local” network, and the other is the “external” network.2 To smartly model this, we need to keep these two dimensions separately instead of confounding in one another. This simplifying assumption is to enable us to keep the model relatively simple and tractable. Furthermore, we also assume that the network distributions are stable (stationary) in regards to temporal changes (in time), as well as any seasonalities involved (assume no seasonality).
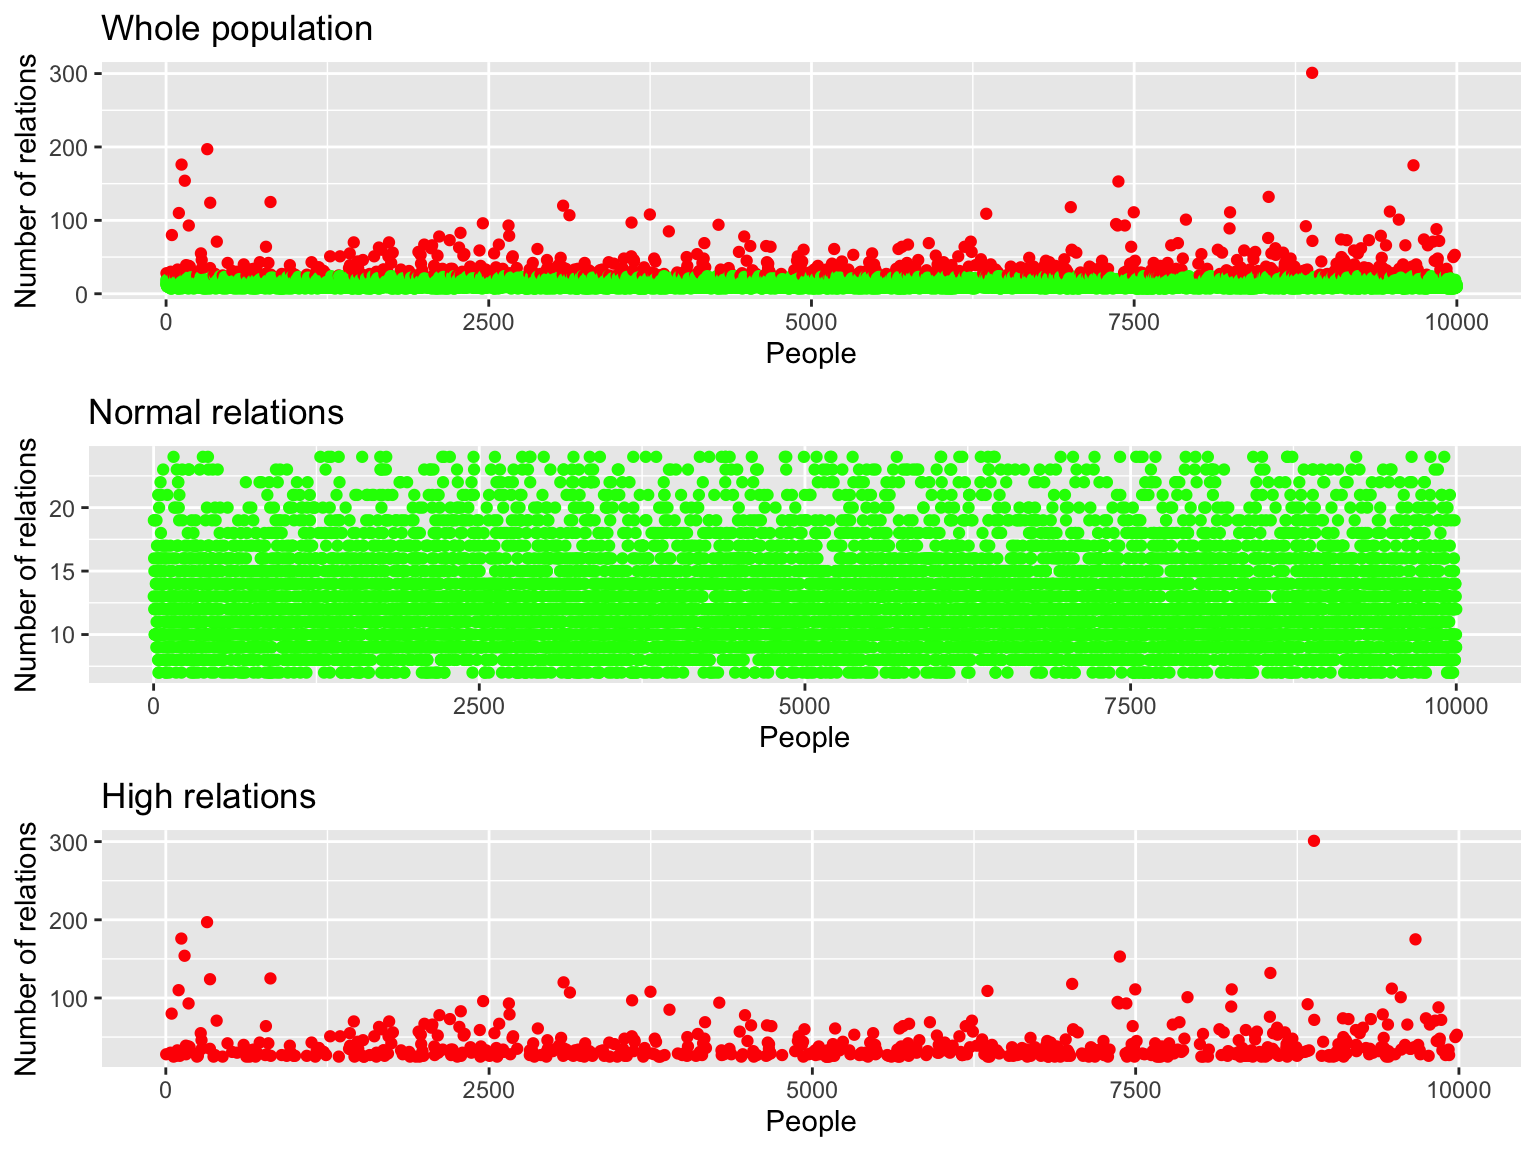
The “local community” network is assumed to follow an Erdos-Renyi random network with a parameter \(p\) or the network density to be \(0.0025\).3 For the external contacts, we model it to follow a power-law distribution with exponent \(\tau = 3\) and a minimum set of \(5\). The combined distributions will have an average of 14 a median of 12, and a standard deviation of 10. The mean and standard deviations are in confirmation with studies in human contacts by Mossong et. al.4 and Klepac et. al.5 We believe that the assumptions used are reasonable reflections of the realities which is supported by many other studies in network science which shows that human relations tends to follow a power-law distributions.6
With the model defined, now we ready to study the implications within the society.
What does “normal” means
We will start by defining “normal activities” of a society. Normal activities are what we normally do on a day-to-day basis - waking up, having breakfast, sending children to school, go to work, perform our work tasks (whatever the tasks are), having lunch break (and coffee breaks in between), go back from work, with possible stops at some amenities, pick-up children from school, and eventually get home. For some, they will go to the mosque for prayers (for various prayer times - at work and home), and eventually, we all will stay home and rest. This is normal for some larger percentage of the people. However, some smaller percentage of the people their “normals” include all of the above, but with a higher degree of heterogeneities, for example, their works involved meeting lots of people every day, they need to meet people at odd hours (such as at night after office hours), they will mix with lots of new people every day, their physical movements will take them to many places in a day or a week, they attend lots of events which involved a large gathering of people, and so on.
As a society, there are also norms that we usually do, for example, once in a while we have social gatherings such as in case of marriages or deaths, we also have feasts and celebrations, and we do travel away from our home or residence to other places such as visiting other cities or locations within the country (for social visits, local tourism, and leisure, etc.). These are the “normals”. But there are also “non-normal” activities which involve large gatherings, which are “non-homogenous” in nature, such as a gathering of a political party, sporting events and concerts, conferences and exhibitions, and others - all have one common character: to bring as many people from an as diverse background as possible to gather in one physical location for some period of time, and the participants are encouraged to mingle as much as possible. These activities also follow almost the same rough principles as described before; that is the “normal gatherings” are a large percentage of all gatherings, and the “non-normal” gatherings are of lesser percentage.
To demonstrate the above, we will show the meaning of it by the following observations from the sample.
In this sample, we show how a sample of a community of 10000 people patterns of relationship (contacts) per day with other people at large, within the community and outside the community. In the case here, we can see that the “total contacts/relations” per day are at 142000 people (against an initial population of 10000). Now, not all the 142000 people are from outside the community since some of them are contacts/relations with people from the same community. Largely these external contacts are contributed by everybody to a differing degree. But what is noticeable is that there’s only a handful of people who are “large contributors” for the “external contacts”, while the large sum of people contributed just around the average, which is 14.
This is demonstrated in the attached plots:
To understand the physical relations of the sample based on the models that we assumed, let us go through a few visualizations of this network.
- Internal community contacts, is described in the following graph.
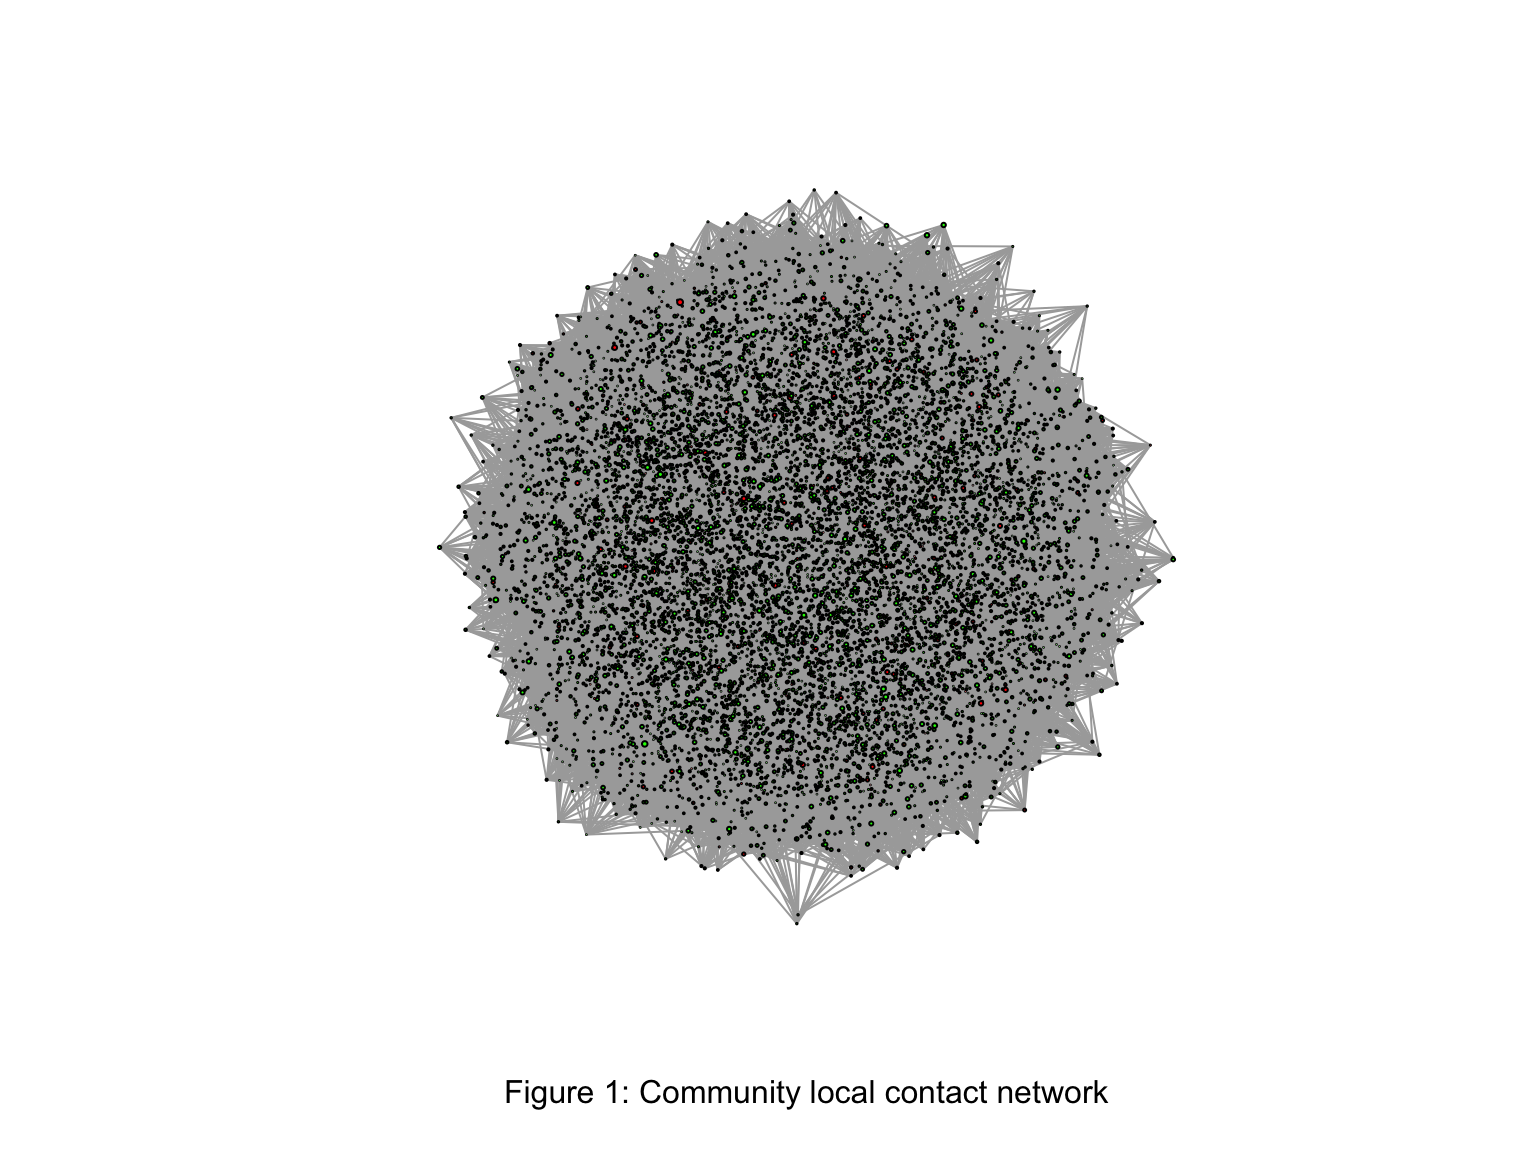
What we can observe here is based on “unweighted” relations between the people within the community, it looks like any “normal” network, where the relations are described through an almost fully connected graph, with a few hubs (such as school, mosques, amenities centres, etc.).
- External contacts network however looks different from the local contacts network.
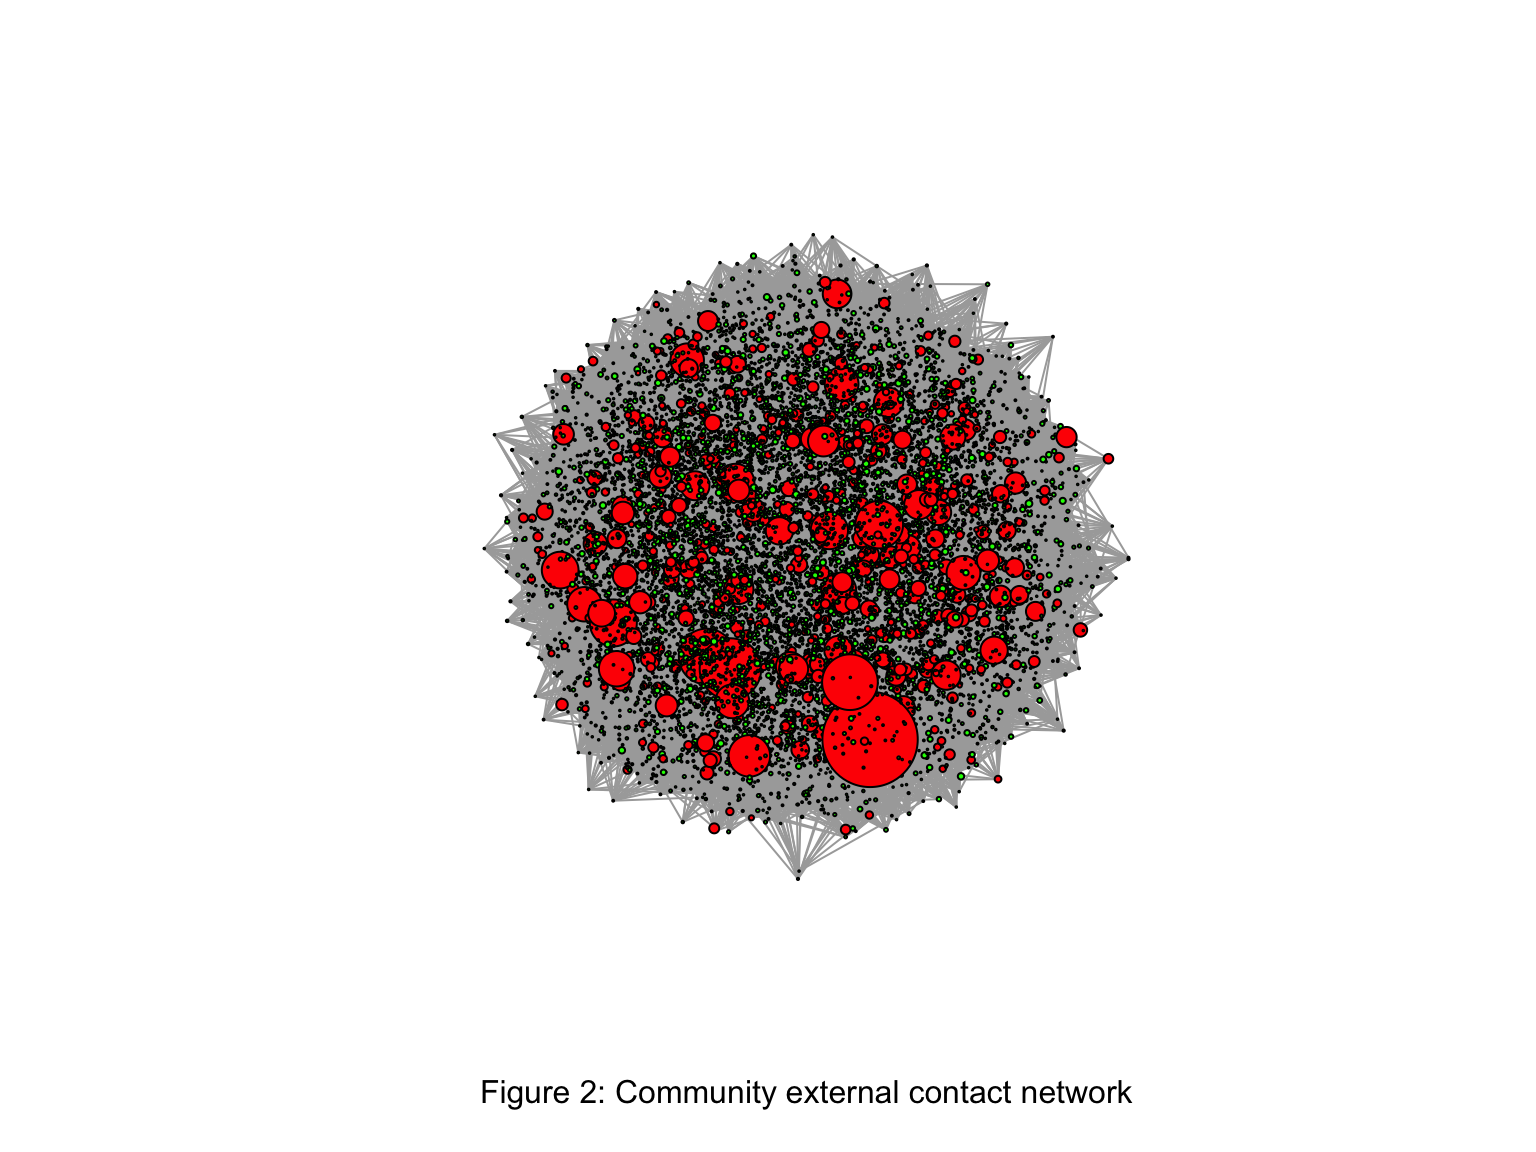
Here we can observe that once we add another dimension to the graph, namely these idividuals “external contacts” as the weight, we can see that some individuals do have a high level of contacts (represented by larger red circles). In network terms, these individuals have a high level of “connectivities”7 with other external networks. The roles of these “large nodes” is extremely critical in connecting other external network to this specific network.
Examples of these individuals in a community are people working in travel industry (such as airline stewardess), or retailing industry (such as a server in KFC restaurant), or high level government officers and politicians (who by nature met and interact with many people on daily basis).
- Combined contacts networks.
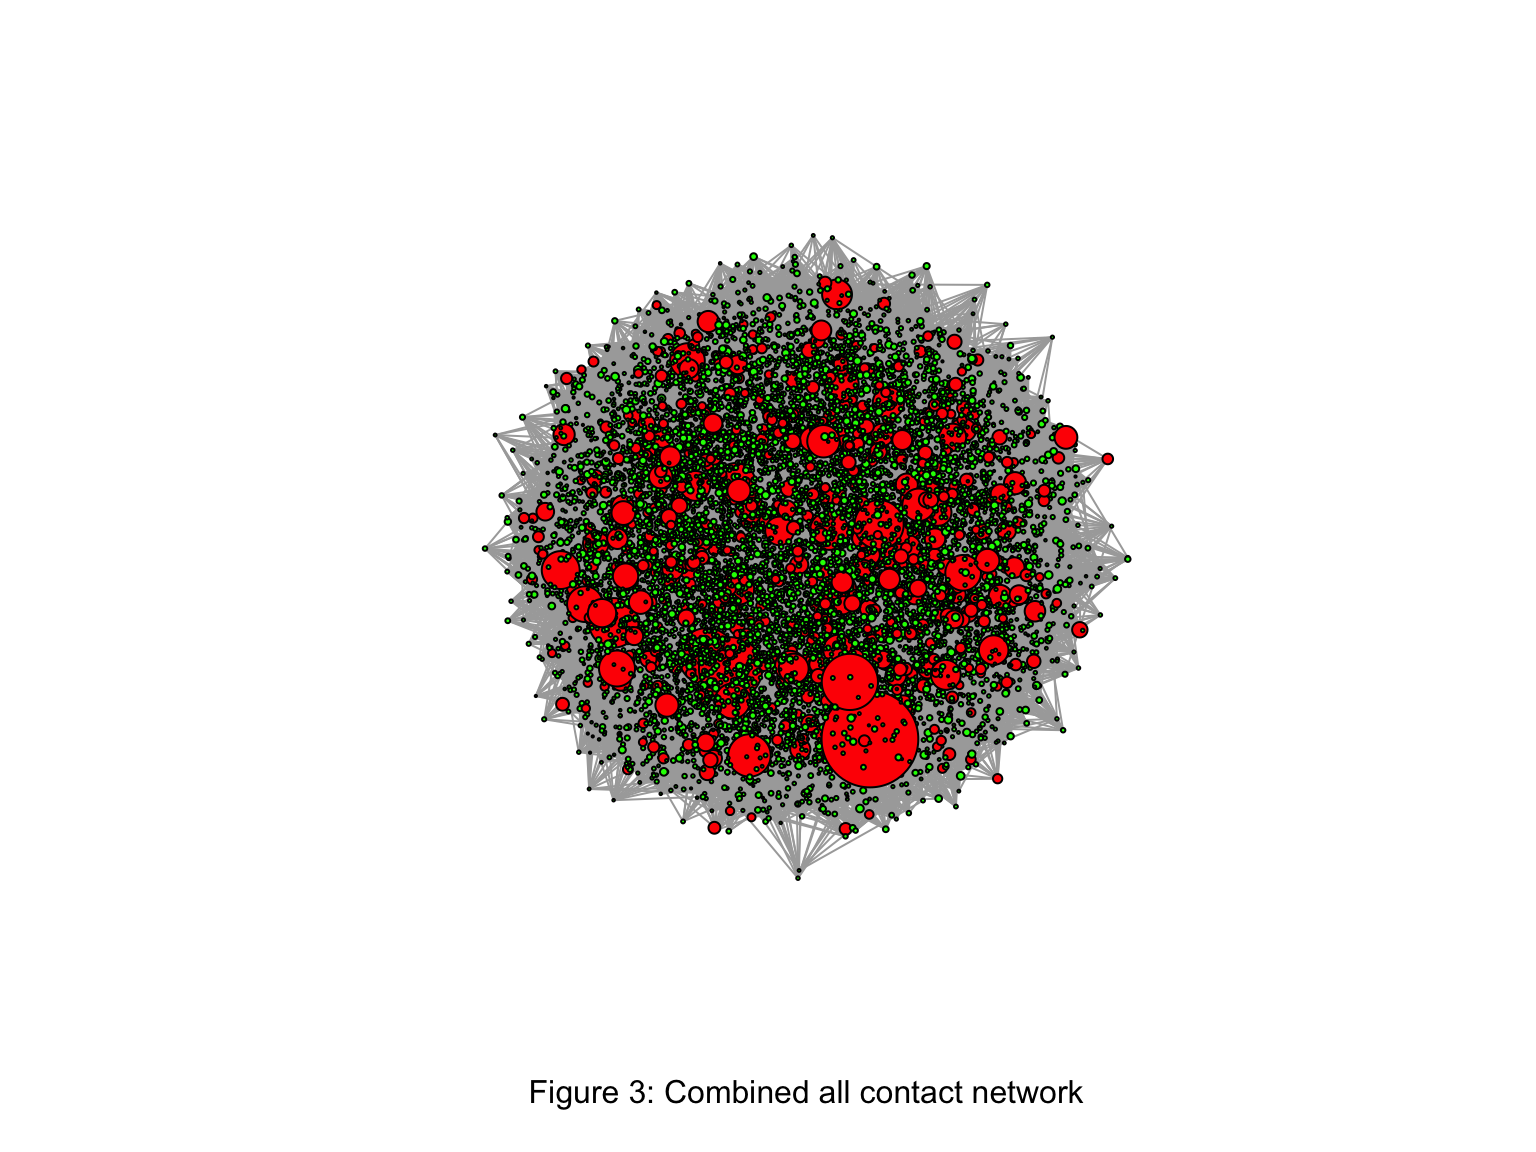
Once we combined both the local contacts and external contacts, we can see that the external contact subsumes in terms of size, the local contacts.
In another word, from 142000 relations daily, 52000 are relations with people from the community and 90000 are with people from external of the community. From another view, on average 1 people intermingle with 5 people from the same community on a regular daily basis, and 9 people from outside the community.
Risk management under disaster response mechanisms
In order for us to understand the structure of human network across communities and within communities, we need to “test” them under a condition. This will allow us to understand the “shape” of the real network, and how the interplay between these networks are affected by its structure and how alterations to these structures may help us to understand the network as well as how it could be managed. Disaster response is one of the most effective way to achieve this.
What we want to show now is if there exists a disaster, such as an epidemic outbreak where pathogens are spread by human contacts, what will happen to the community? We will demonstrate the “normal case” and then we consider the “response” cases.
Here we will use the SIER model that we have developed earlier for the Covid-19 epidemics. For details, please refer to earlier writings. Based on the parameters that we obtain from the actual data, we will use the parameters to model our simulation of the disease prevalence within the community as produced as a sample here.
Let us modeled the situations as different level of impositions, from the most relaxed (i.e. normal), to the harshest (i.e. total lockdown). This is described as questions below:
- What will happen if we do not alter the network structure? i.e. leave as “normal”. This is Case 1.
- What will happen if we restrict the relations between communities (i.e. control external relations). Here we subdivide the cases into a few: A. What will happen if we reduce the impact of “high relations” people by restricting their relations by 50%, and leave everything else to be the same. In another word, we want to limit their roles in connecting the communities. This is labeled as Case 2A. B. How about if everone reduces their external relations (i.e. limiting external exposures) by some percentage? This is labeled as Case 2B. C. How about if we don’t allow any relations between the communities (i.e. inter-community lockdown)? This is labeled as Case 2C.
- What will happen if we exercise inter-community lockdown; here we further sub-divide the case into two: A. We have a “weak social distancing” within the community, whereby people still performs their daily activities, but on a reduced basis. This is labeled as Case 3A. B. Finally, we have a “strong social distancing”, whereby everyone will have to stay home among their family members. This is Case 3B.
Case 1 : “Normal”
If we assume no changes (i.e. no restrictions), we will have the following condition:
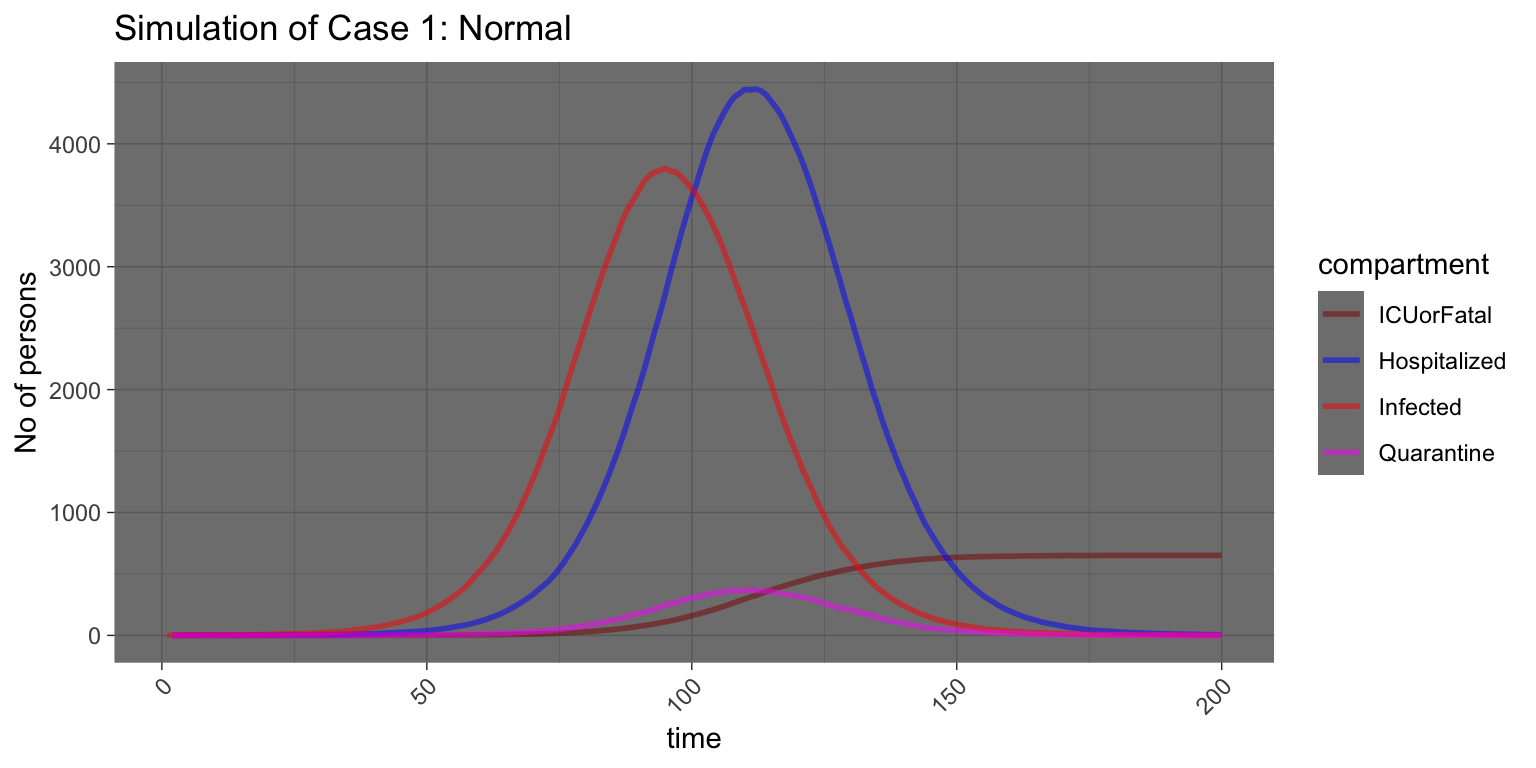
We have a situation within a short time (in units of days or less, depending on the spreading rates of the disease), whereby we have 3800 (or more than 30%) of the community will be infected, and require hospitalization, and case fatalities will occur.
Case 2: Control external relations
Now let us pose a situation, where we will still allow the community to have external relations with the outside community, with one key condition, that the “large network” individuals are restricted to reduce their exposures to the norms of the others (i.e. the average), and everyone else also behaves more strict in terms of their relations (for example, only work-related contacts) and no extra-curricular contacts.
Case 2A: 50% reduction by “high contacts” people on their external relations.
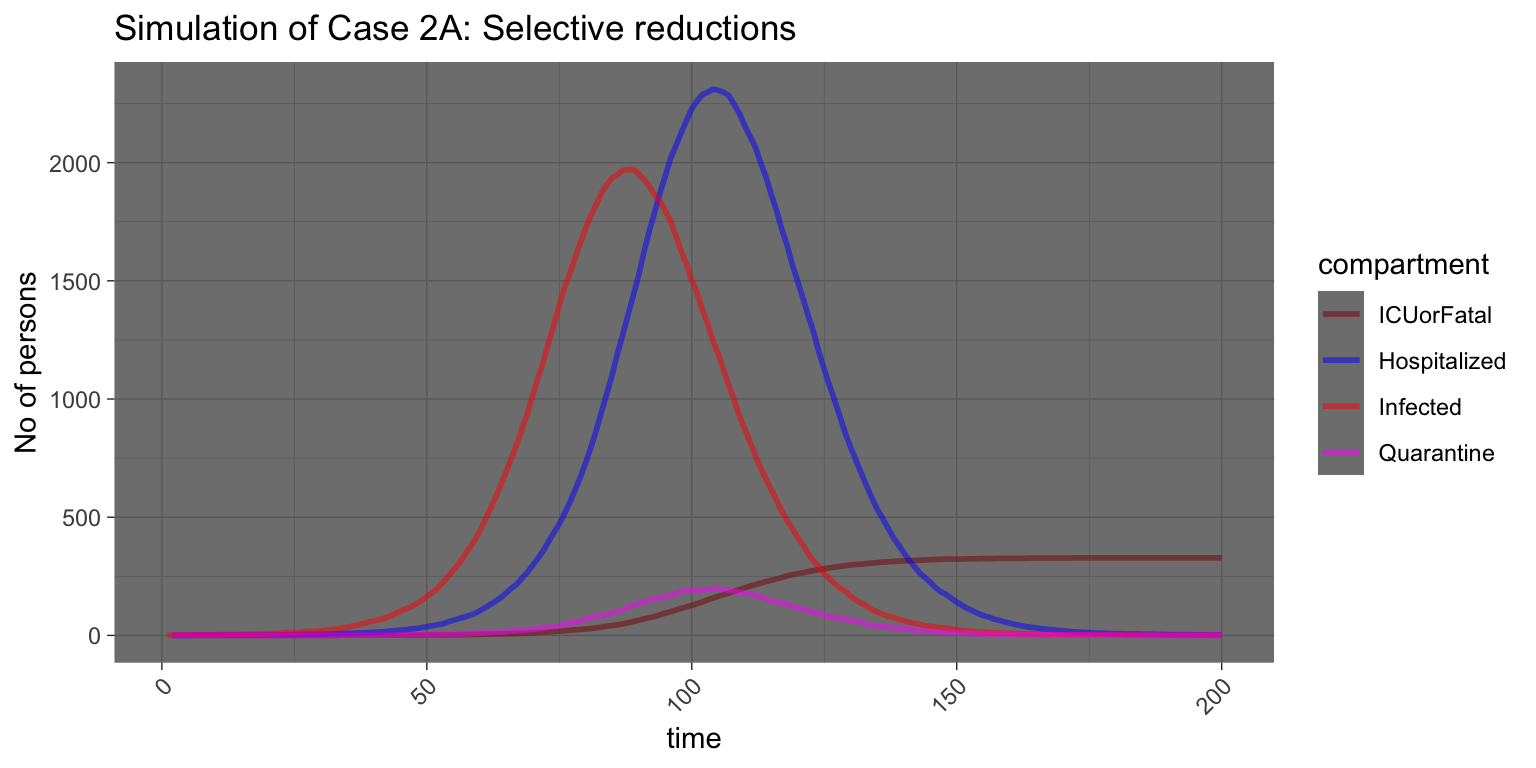
We can see that a significant reduction is achieved from the original situation as represented in Case 1, where we have about 1972 people infected as opposed to above 3800; a reduction of 0.9269777%.
Case 2B: 50% reduction by everyone on their external relations.
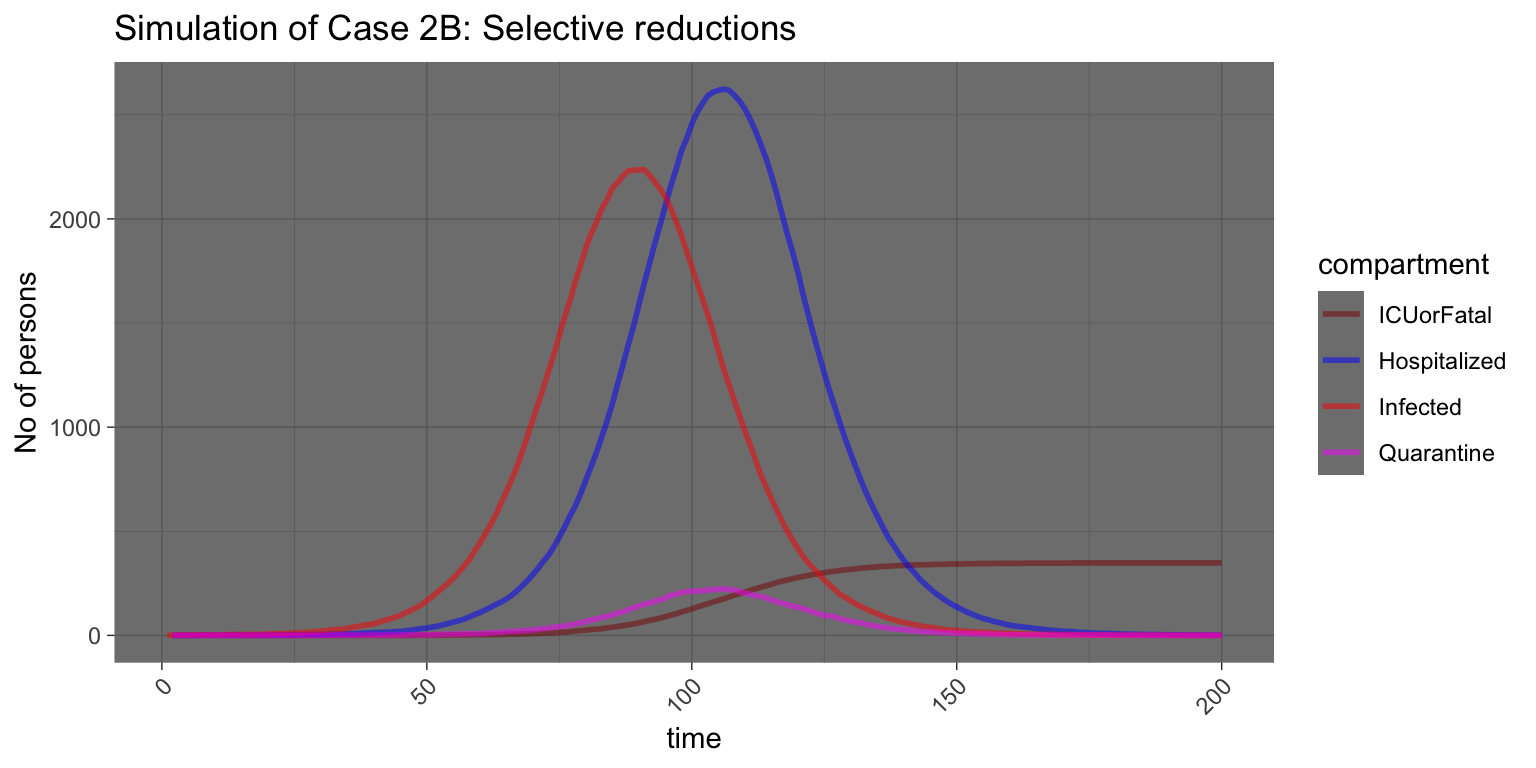
The impact of reducing everyone on their external relations does not gives much improvements, only a reduction of -0.1184622%. This shows that as far as external relations, the “highly connected” people are playing more important roles as compared to the rest of the people.
Case 2C: 100% reduction by everyone on their external relations.
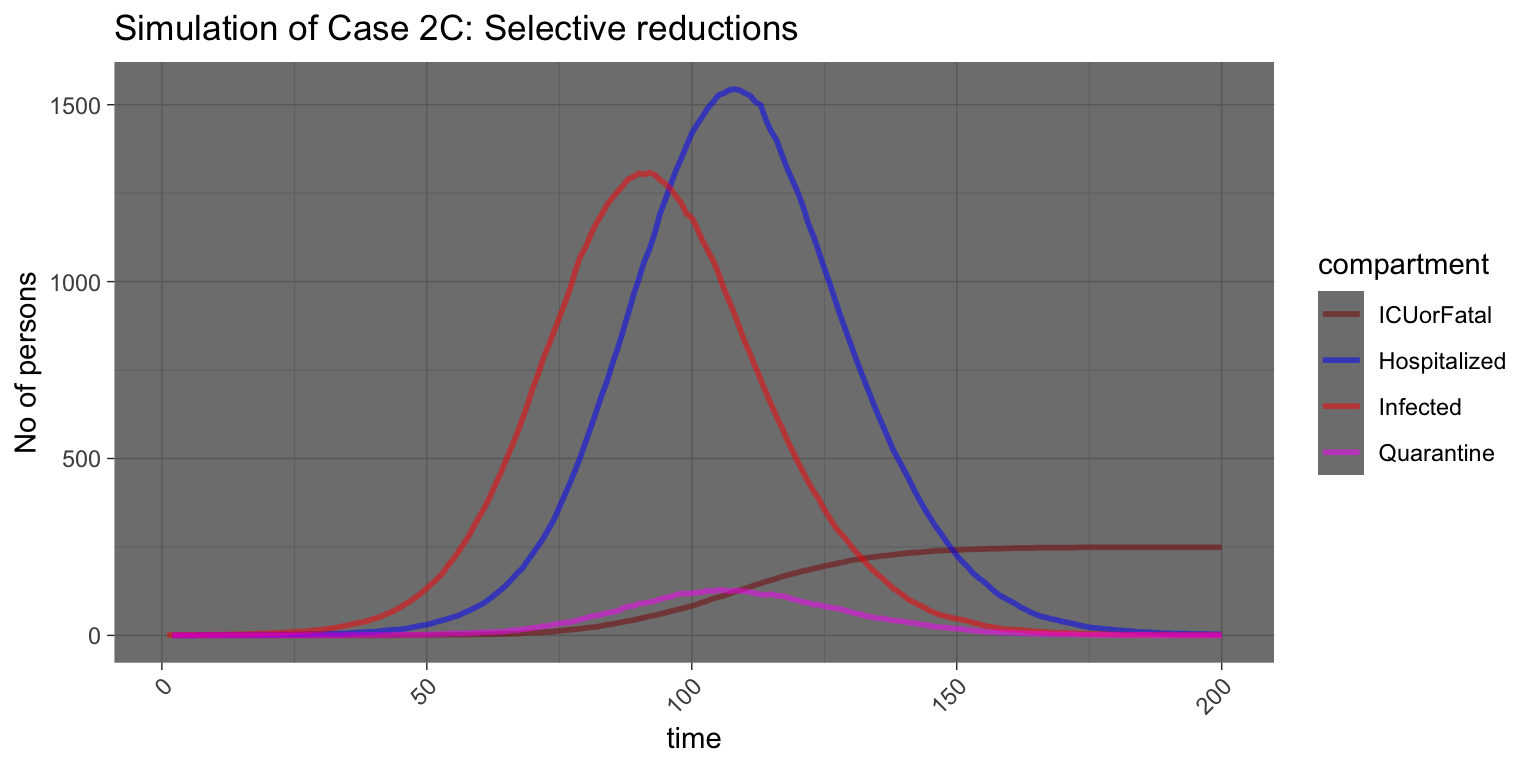
Here we can see that once we “lockdown” the entire community, we will have a significant impact in reducing the disease spreading by half compared to the “normal” condition. Now we have 1308 infection as compared to 3800 in Case 1. The main reason why the numbers are still high is mainly due to “internal” community infections, instead of infections coming in from outside the community, by the people who are already infected prior to lockdown.8
Case 3: Control within community relations
Case 3A: 100% reduction in external relations, and 50% reduction in intra-community relations
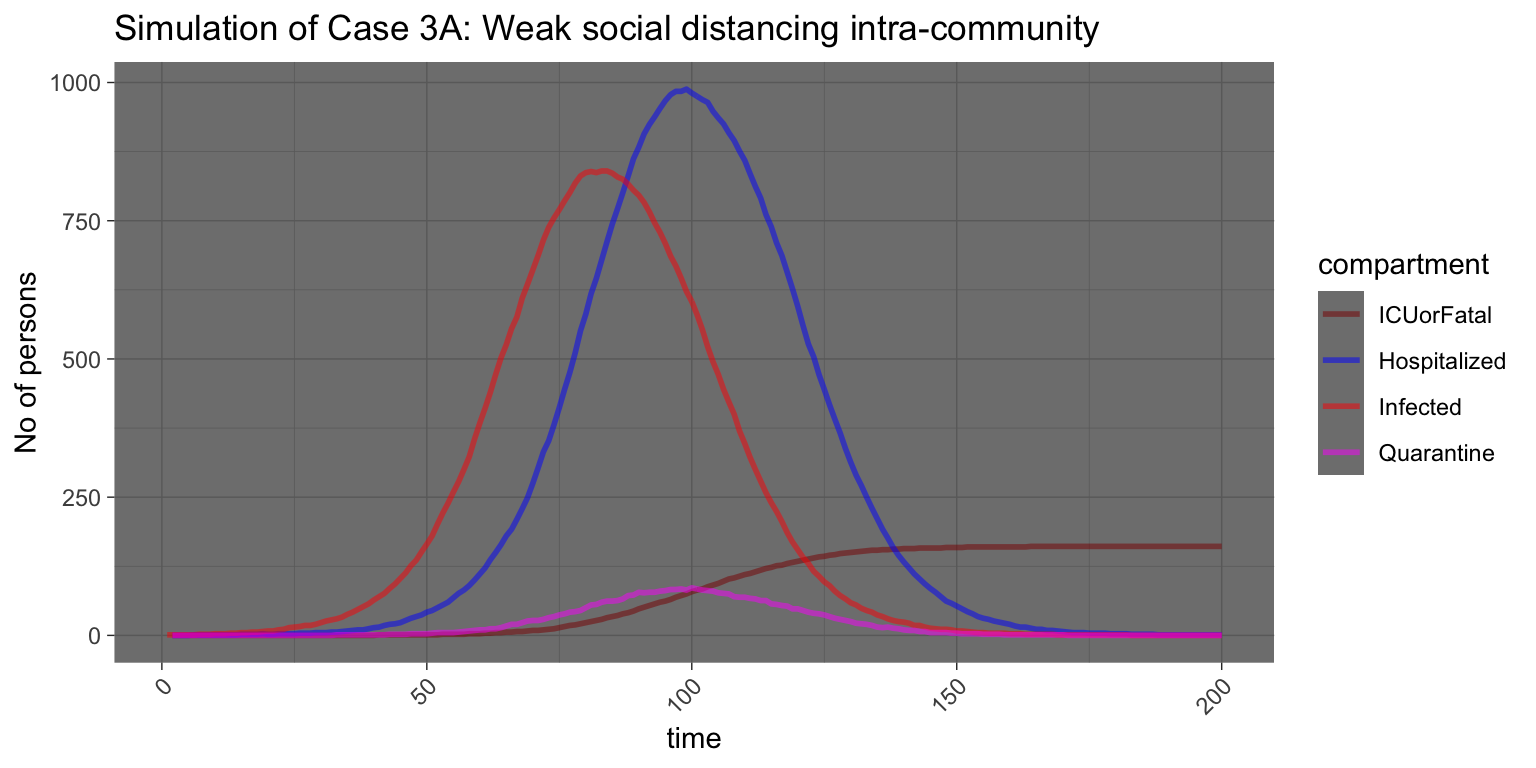
Here we have a further reduction of cases to 840 infection, which means that a further restrictions within community helps to a degree.
Case 3B: Strong social distancing
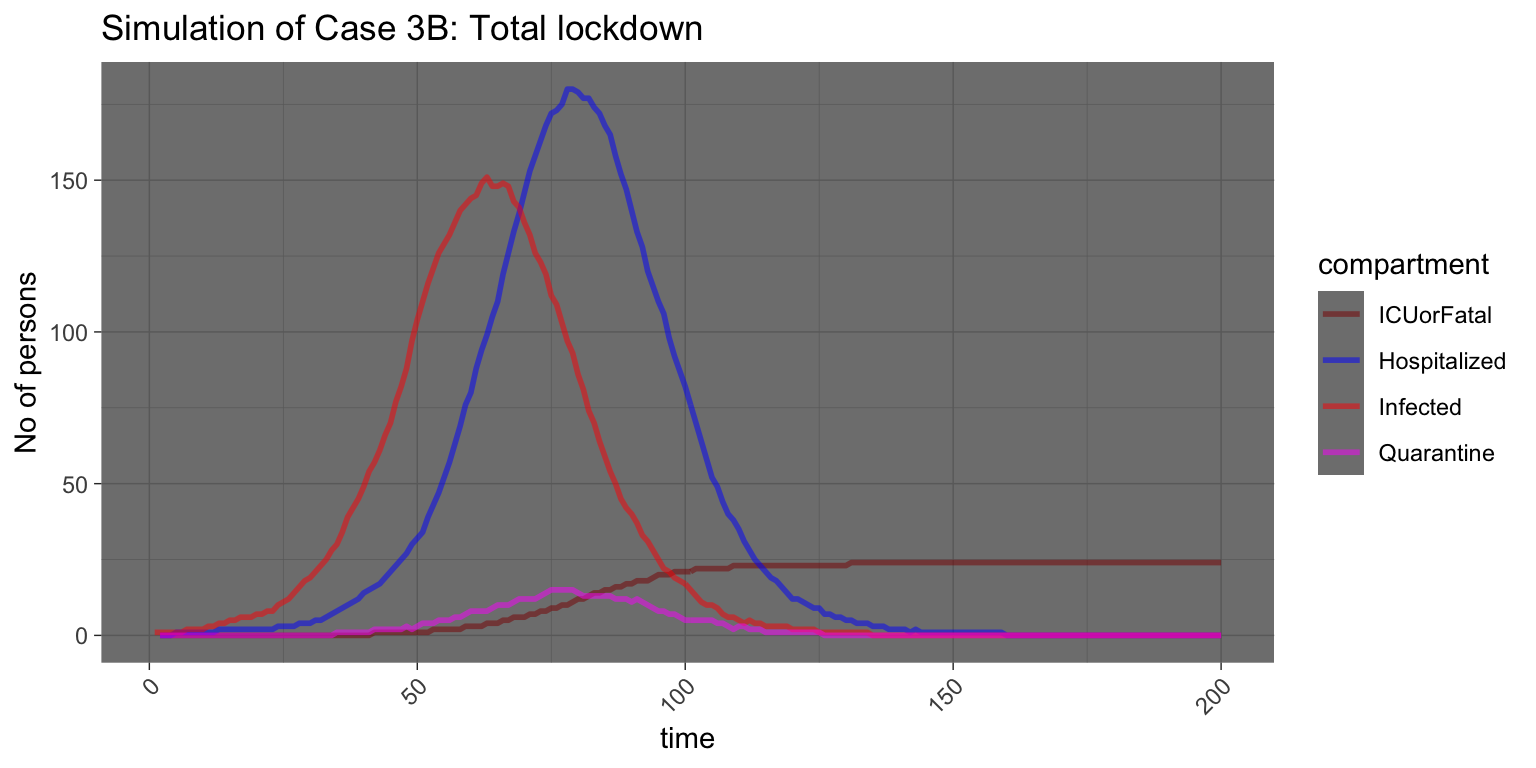
And finally, if we have a total lockdown, the results of which we would have only 151 infections - which depends on the readiness of the community, would be something that is manageable.
Calculations (measures) of “distancing” via human mobility metrics
What we have provided in the model is to give general indications about the various needs of response required within a disaster response model, relying on the human contacts network assumptions. However, in real life we know that “social distancing” or “human distancing” are complex measures that are not easily calculated. Furthermore, as we have alluded to, many of the metrics (such as the number of contacts or relations) do not follow “well behaved” probability distributions with the existence of fat-tails. In any case, as a guide what could be measured and probably some rankings of it can be used.
There are few candidates which could be used:
Distance traveled per day - which we can use Origins-Destinations data for automobiles. Various proxies can be used, such as the percentage of cars on the road during certain hours. As an example, at the normal time, we can assume that the highest “distancing” between people is at midnight, when most people are at their home against 9 am when most people are on their way to work. Benchmarked between the two extremes could give us some indications.
Non-essential visitations - which we can use the density of people during non-working hours, such as during the weekend (Sunday) and during after office hours (after 10 pm), leisure (8 pm to 10 pm), etc.
Benchmark against an average of the country or city or similarly comparable places.
Based on the candidates, scoring or scorecard can be generated based on the index created. This scorecard can be created as “grades” such as A,B,C,..,F etc., recognizing the levels of requirements under certain conditions of situations, such as response to disasters (such as Covid-19).
The society at large could develop these measures and use them as their guide, or governmental authorities can determine what would be the best measures to use. This is a subject that we will leave for later discussions.
Covid-19 as stress-test case
Covid-19 is a significant test case because it test the system to the maximum, mainly through the transmission process of the disease, which follows a massively exponential growth due to few factors (which are confirmed by the current state of affairs) - namely, the transmission occurs “inadvertently” due to asymptomatic behavior of the disease, and the survival of the pathogen in the environment which makes human contacts to be un-necessarily direct, which is almost similar to airborne pathogens.
What we could learn though is to obtain the extreme measures of human mobility and contacts during the period, since for the first time a major shutdown of the human network is imposed through a countrywide lockdown. While lockdown is imposed, absolute essential activities needed to be maintained, and thus we could also measure the “minimum threshold” of these essential levels, and what it could mean.
For Malaysia and elsewhere, various countries response to the Covid pandemics could be used as lessons and studies. Modeling based on real data and real actions could further assists us to understand whether the modeling that we use here, could be a guide. Again, we have to mention that given the limited availability of reliable data, and the knowledge regarding the pathogen is still incomplete, we would say that for now we just have to rely on the modeling exercise and simulations.
Lessons
What we could gain from the above modeling and simulations?
Clearly, the “dense” nature of human distance is an issue that needs a serious relook. While we understand that the dense nature arises of many possible reasons, such as the process of urbanization, human socioeconomic activities, culture and societal norms - which gains from the “scale” of being denser instead of sparse. Probably as human advances, the denser we could become. Dense here doesn’t necessarily imply population density, rather it means that the “distance” between humans is exhibiting “small-world property” in terms of human relations network properties.
What we have shown here leads to a few discussion points:
The structure of the human network, such as “contact network” as we have shown here demonstrates that the dense nature of human physical contact networks increases the risk of any transmissions of unwanted matter significantly with the increased nature of the network density. More importantly is the scale of this increases, which may exhibits “scale-free” behavior, hence the spreading nature could quickly spiral upwards which is explained by the percolation threshold of the network. It is proven that a scale-free network with a high exponent (above 2) easily could percolate at low thresholds. If we as a society could determine these dangerous thresholds (in terms of its limits), then we could prevent cascading failures from happening (in a similar manner we could prevent power outage of a city due to percolation events).
By understanding the nature of the human network, we as a society could also work to prevent these cascading failures by reducing the aggregate measures of our activities. This issue, however, is a delicate and complex subject as well, since it revolves around social choice, and require us to investigate this within a social choice frameworks (and theories). For example, could we on aggregate reduces our human contacts by 25%? The answers depend on the relative conditions of the people because for a large number of the population, their level of human contacts probably is already at its optimum minimum (i.e. to perform basic functions without loss of positions). Here the network simulations that we have shown could give us more directions - namely for the “few members” of the society which perform their shares too much larger than the norms, and in fact, it becomes a large “externalities” for the rest of the community. The question is then, would these small percentage of people be willing to do their part to reduce their “contributions to these externalities”? This argument is the same as polluting the environment, where a small number of people contribute to a large amount well above their “normal share” of pollutants. How do we as a society penalized them or incentivize them to either pay for their externalities or pay them to reduce? We are then back into the problem of “the tragedy of the commons”.
“Tragedy of the commons” problem, so far could only be solved by the authorities, as the “social benevolent dictator” - which decides and enforce on everyone what’s needed to be done. The lockdown of Covid-19 is an example of how this dictator could work. However, it only works in the situation where the choices are extreme, between a total ruin or a lesser ruin - which in game-theoretic terms, is a solution to a Prisoner’s dilemma game’s forced cooperation between the dictator (government) and the public. It is known from PD (Prisoner’s Dilemma) game however that the solution is “unstable” when the game is repeated over time (i.e. repeated PD game), and it also critically dependent on the payoffs (or penalty structure) as well as the constraints involved for both parties in the game. The main problem that arises rooted in the process of democracy itself, where the incentive of the government (of the day) is to ensure that they can win the next elections - which then makes the choice for them to decide what’s “popular”, rather than what’s “right”. Because what’s right usually involves unpopular moves, such as increasing taxes and removing subsidies, or reducing wastage and increasing efficiencies, and so on. Whereas what’s right are usually longer-term effects in nature and will not be seen immediately. Given that the majority of people are myopic (short-sighted interests), it is very hard to convince the majority to change their stance on short-term interests as well. In another word, in terms of PD game, both will opt for lesser than optimal solutions, despite that the game is being played repeatedly, until the risk of ruins becomes so large that both parties, by force, choose the optimal solutions. But then again, the temporal nature of this optimal solution could not hold too long, and we could be back to the less optimal situation.
Epidemic spreading in scale-free networks.,Pastor-Satorras R, Vespignani A.,Phys Rev Lett. 2001 Apr 2; 86(14):3200-3↩
Studies by Klepac et. al. shows that there are two distinct sets of contact relations, one is for “local contacts” which under the category of “home” based contacts, and “work” contacts, which is contacts made during the working hours. The ratio between home and work is 1 to 3, on average↩
The network parameters are as follows: the maximum distances is 5, average distances is 3.1510972, the average degree is 24.9836, and finally the “small world property” measure is `
2.8619366, which is almost equal to the average degree; hence confirms that the random graph chosen exhibits small world properties, which is the case for most human relations networks. Reference: Network Science, Barabasi, A. L., Cambridge University Press, 2016.↩J. Mossong, N. Hens, M. Jit, P. Beutels, K. Auranen, R. Mikolajczyk, M. Massari, S. Salmaso, G. S. Tomba, J. Wallinga, J. Heijne, M. Sadkowska-Todys, M. Rosinska, and W. J. Edmunds. Social contacts and mixing patterns relevant to the spread of infectious diseases, PLoS medicine, 5(3):e74, 2008. ISSN 1549-1676↩
Klepac, Petra, Adam J Kucharski, Andrew JK Conlan, Stephen Kissler, Maria L Tang, Hannah Fry, and Julia R Gog, Contacts in context: large-scale setting-specific social mixing matrices from the BBC Pandemic project, March 2020, medRxiv preprint doi: https://doi.org/10.1101/2020.02.16.20023754↩
The distributional choice that we make do not exactly follow the conclusions both studies due to a few reasons: a) They do not emphasis the shape of the contacts distributions, b) The focus on the studies is more on age and demography. For a general reference on human social network and power-law distributions, please refer to: Barabasi, A.L., Network Science.↩
In network terminologies, this is called “betweeness”↩
This is the case which occurs in Singapore, whereby when the lockdown communities without having any strong measures within the sub-community, the disease spread among these sub-communities still took place↩