Table of Contents
Pre-amble
This is a follow up article to a series of articles published earlier. As noted in the previous article, the exercise of modelling Covid using simple SIR model, whilst provide some basic insights, the process itself (based on a very limited data, namely the incidence data) is error prone and contains large errors in the estimates of \(Ro\), the disease reproduction number. This necessitates us to perform a dynamic simulation exercise to enable us gain more insight to the outbreak as it is progressing (as of today).
Some of the codes are obtained from Tim Churches1, as well we use packages from RECON2, and our own codes developed by Techna Analytics Sdn. Bhd. In particular we rely on the following packages in R: distcrete, epitrix,incidence,earlyR, and most notably EpiEstim.
Data sources and limitations
Obtaining detailed, accurate, current data for the COVID-19 epidemic is a problem faced by data scientists. Uniformity of classifications and accuracy of timing of reports is not clear from most datasets (for example timing of symptoms, testing, and confirmations). All of these present problems to modelling based on these data to forecast or predict trajectories of the disease as these creeping errors are unavoidable.
The solution is for authorities to provide line-listings of all cases, including their date of reporting and their date of onset of symptoms, even if only presumptive dates are provided (and missing dates of onset can be imputed, in any case). No details that permit identification of cases or invasion of their privacy need be provided in such line listings.
The lack of empirical serial interval data is also a problem, as the serial data is extremely useful in most of the modelling exercises. As we have explained earlier, based on what we have learned from the data, the serial-interval has a very large variations (from 1 to 10 days, and possible values of 20s). If detailed data is available, then corrections and a much more precise estimates of \(R_o\) could be further improved.
Force of Infection analysis
One of the measure (beside \(R_o\)) as the rate of growth of an epidemic, is the relative current “force of infection”, called \(\lambda\):
\[ \lambda = \sum_{s=1}^{t-1} {y_{s} w (t - s)} \]
where \(w()\) is the probability mass function (PMF) of the serial interval, and \(y_s\) is the incidence at time \(s\). The usage of “force of infection” is particularly important for public health policy makers in determining the effectiveness of any control measures undertaken, in particular to measure the weakening of the force of infection after any measures are taken. This is easily observed by plotting the \(\lambda\) over the period and forecasting them onto the future.
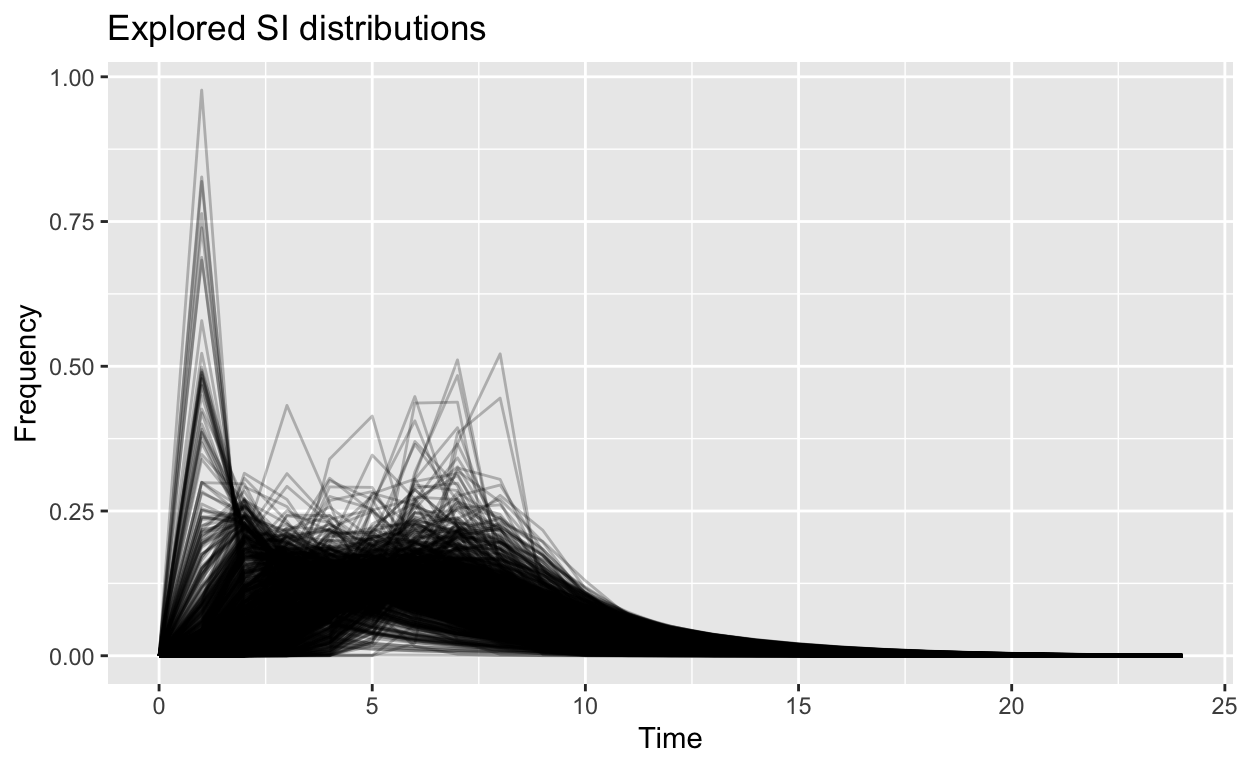
The critical parameter for the calculation is the distribution of serial intervals (SI), which is the time between the date of onset of symptoms for a case and the dates of onsets for any secondary cases that case gives rise to. Typically a discrete gamma distribution for these serial intervals is assumed, parameterised by a mean and standard deviation, although other type of probability distributions are also realistic. Detail discussions on probability of similar disease is available in Vink et. al.3
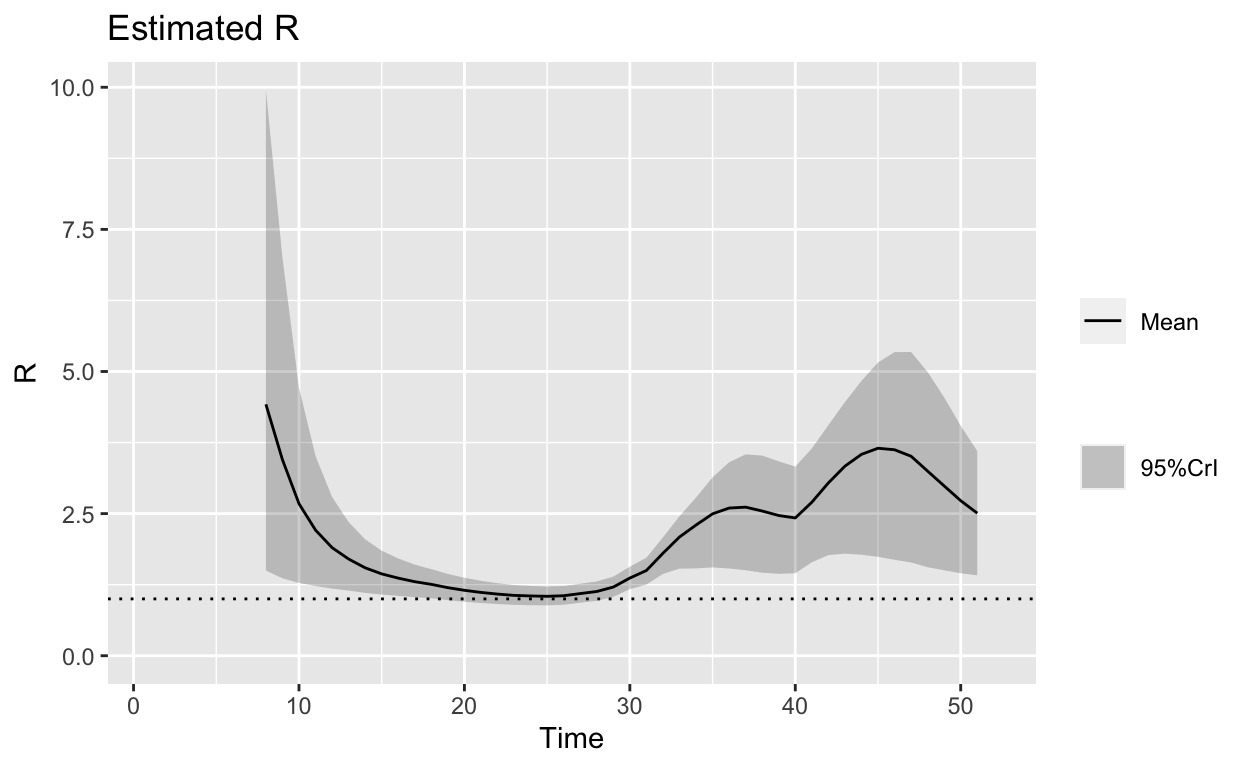
To allow further randomness into the model, we need to perform various scenario analysis based on varying parameters of the serial interval distribution by specifying a distribution of SI distributions for the estimation of the instantaneous effective reproduction number \(R_{e}\). Using Hubei data as a guide, the mean SI estimate of 7.5 days, with an SD of 3.4, and allowing the mean SI to vary between 2.3 and 8.4 using a truncated normal distribution with an SD of 2.0. Furthermore, the SD is allowed to vary between 0.5 and 4.0. For the estimation of the force of infection \(\lambda\), for the Serial Interval we’ll use a discrete gamma distribution with a mean of 5.0 days and a standard deviation of 3.4 as our starting estimates.4
This is summarized in the table below:
| Parameter | Range | Reference | Distributions |
|---|---|---|---|
| initial mean SI | 5.0 | Hubei | discrete Gamma |
| initial SD SI | 3.4 | Hubei | discrete Gamma |
| varying mean SI | 2.3 to 8.4 | Others | discrete Gamma |
| varying SD SI | 0.5 to 4.0 | Others | discrete Gamma |
Why we use Hubei as initial estimates? Because it has shown some successes in containing the outbreak at local level. Therefore it is probably the only available benchmark to date. Data from South Korea might also be useful for this purpose (as of date of writing, data is not yet collected and hence not yet analyzed by the author).
These plots are the same as the one in the previous article, reproduced as reference.
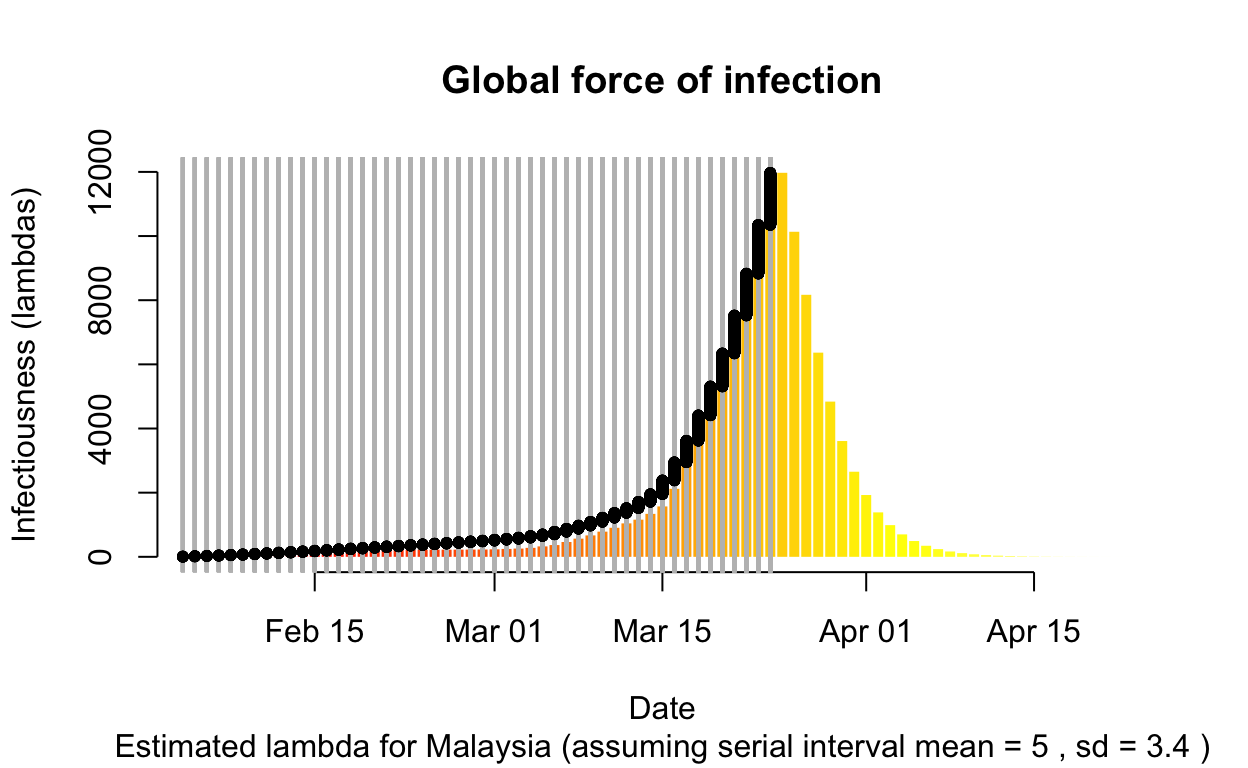
To interpret the above plot, let us understand what the force of infection, \(\lambda\) is measuring: potential number of new people infected (infection generated) in the population if the disease is let to run on its own course assuming that now new entrants of sources of infection (i.e. based on the originally counts of infected people). In another word, the curve predicts the secondary and subsequent level of infections in the population. As we can see, from the original 3 to 10 cases, we could potentially have 10,000 people infected by the end of March.
From public health point of view, this what’s necessitate the tracing and isolating all the people who have contracted the disease, containment of people who had exposure, increase social distancing measure among the populace. Furthermore, no new entrants of case origin (i.e. such as from overseas) into the populace must be allowed.
Probably what’s unique about Covid is the serial-interval behaviors of the disease and it’s force of infection.
Covid’s Serial-Interval analysis
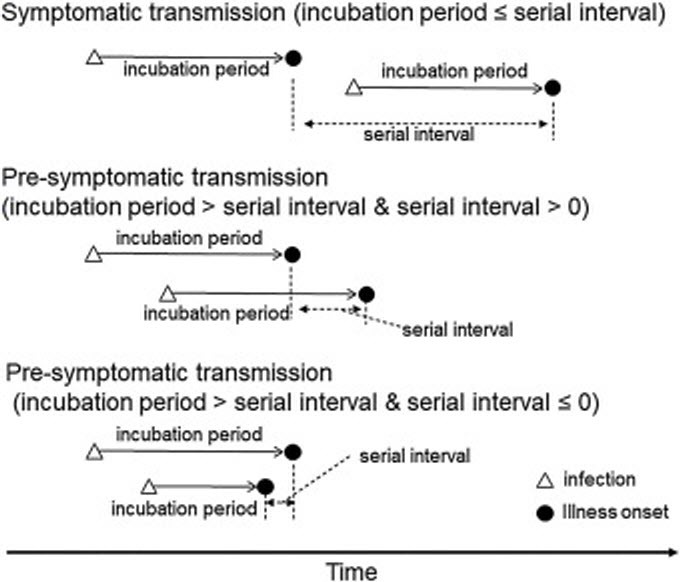
Serial interval is about the disease transmission process which involves the estimation of how long is the incubation period and when will the asymptomatic signs detected, and finally when will the person be illed. This is explained in the following graph taken from Nishiura et. al5.
As comparison with SARS, H. Nishiura et. all, produced the following graph:
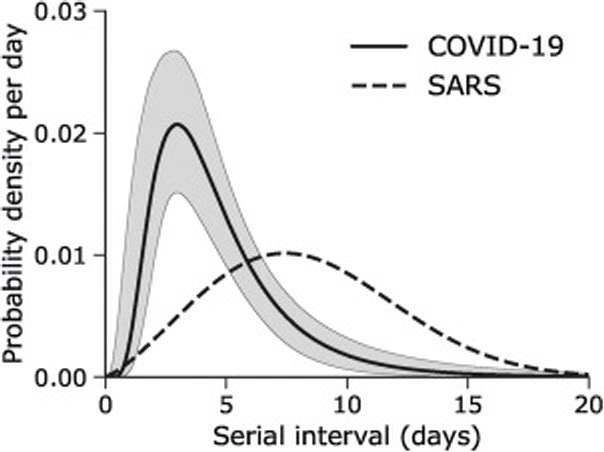
Research on Covid’s serial interval (short form, SI) distributions is just coming out. For example: H. Nishuara et. all in International Journal of Infected Disease, April 1, 2020 (pre-publication), provide the estimate of SI for their sample of 28 infectee/infector having median serial interval at 4.0 days (95% credible interval [CrI]: 3.1, 4.9) using similar assumptions of probability distributions of lognormal process as we used here6. Z. Du et. all7 provide almost similar estimates of mean interval was 3.96 days (95% CI 3.53–4.39 days), SD 4.75 days (95% CI 4.46–5.07 days); based on studies on 468 confirmed cases in China (cases from late year 2019).
What is evident from the above studies and results of our simulation (which uses mean SI of 5 and SD of SI of 3.4) demonstrates that Covid is having shorter serial interval than SARS. And what is still unknown (until further studies and research) is the length incubation period (period before serial interval), whereby pre-asymptomatic transmission occurs. Because of this, all estimates of SI for Covid potentially could be biased downward (i.e. underestimate the length of SI) as cautioned by Nishiura et. all and Z. Du, et. all.
Furthermore the relationship between SI and force of infection, \(\lambda\) is not clearly understood (or known with less uncertainty). That is despite having a short SI, the level of infectiousness (\(\lambda\)) could be high. This is demonstrated in our simulations earlier.
As a guide, WHO reports on SARS 20038 conclude that in the case of SARS 2003 epidemic, the median of incubation period is between 4 to 7 days (across various countries), no clear conclusion could be made on the infectious period (in all countries - for which it recommends more studies and research), case fatality ratio of 1.4% to 16% (varying across countries).
These measures of SI and the assumption of the shape of the distributions and is derived parameters (mean and SD) (discrete gamma as used by H. Nishuara et. all, or truncated normal as used by Z. Du et. all) are critical for the computations of dynamic \(R_E\). This is what we turn to next.
Conclude
In this writing we have performed simulations and presents our results on two major factors in understanding Covid outbreak for Malaysia. In the abscence of detailed clinical (patient data), we resort to perform bootsrapping exercise to derive the estimates of the parameters for the force of infection (\(\lambda\)) and the likely shape of SI distributions for Malaysia.
We note that with so many limitations of availability of data with case details (i.e. patient by patient data) to perform similar exercise of H. Nishuara et. all or Z. Du et. all (or similar cohort studies), and the errors involved in estimating the SI distributions (shapre of the curve as well as the parameters), the simulations could serve only as a guide for general purpose of understanding the problems rather than used for policy making and public health solutions.
R Epidemic Consortium https://www.repidemicsconsortium.org↩
Vink, M.A., Christoffel, M.,Bootsma, J., and Wallinga, J, Serial Intervals of Respiratory Infectious Diseases: A Systematic and Analysis, American Journal of Epidemiology, Volume 180, Issue 9, 1 November 2014, Pages 865–875, https://doi.org/10.1093/aje/kwu209↩
This follows Vink et. al., and other studies referred in this article.↩
Nishiura, H., Linton, N.M, and Akhmetzhanov, A.R, Serial interval of novel coronavirus (COVID-19) infections, International Journal of Infected Disease, April 1, 2020 (pre-publication). https://www.ijidonline.com/article/S1201-9712(20)30119-3/fulltext or https://doi.org/10.1101/2020.02.03.20019497↩
Nishiura, et. all↩
Du Z, Xu X, Wu Y, Wang L, Cowling BJ, Ancel Meyers L. Serial interval of COVID-19 among publicly reported confirmed cases. Emerging Infectous Diseases. 2020 Jun (Early release). https://doi.org/10.3201/eid2606.200357↩
Consensus document on the epidemiology of severe acute respiratory syndrome (SARS), World Health Organization, 2003; https://www.who.int/csr/sars/en/WHOconsensus.pdf↩